
NEAR Protocol Price Prediction: Will $4.44 Support Hold or Break?

0
0
Is NEAR sliding toward a breakdown, or just shaking out weak hands before the next run?
That's the real tension in this NEAR Protocol price prediction, written on Oct 24, 2026 at 11:30 UTC with a price near $4.52.
An earlier October forecast flagged this exact range. Now the floor is getting tested. Bias is bearish for now.
NEAR Data Snapshot: Key Numbers at 11:30 UTC
Numbers first, opinions after. Figures come from CoinMarketCap price data as of Oct 24, 2026, 11:30 UTC.
Metric | Value |
Price | $4.52 (-7.15% in 24h) |
24h range | $4.43 to $4.96 |
Market cap | $5.92B |
24h volume | $848.27M (+12.1%) |
Rank | 17 |
All-time high | $20.42 on Jan 17, 2022 |
Bitcoin price | $80,550.16 (-1.23%) |
ETF net inflow, Oct 23 | $992.69K |
Rising volume during a drop usually means sellers are active, not bored.
NEAR Price Analysis: Weaker Than Bitcoin
This NEAR price analysis starts with a gap. Bitcoin slipped 1.23%, while NEAR fell 7.15%.
Six times harder. Tracking the latest crypto market news helps confirm whether sentiment shifts.
But the bigger trend isn't broken. And a 90-day gain of 152.41% still stands.
NEAR Technical Analysis: EMAs and RSI Tell the Story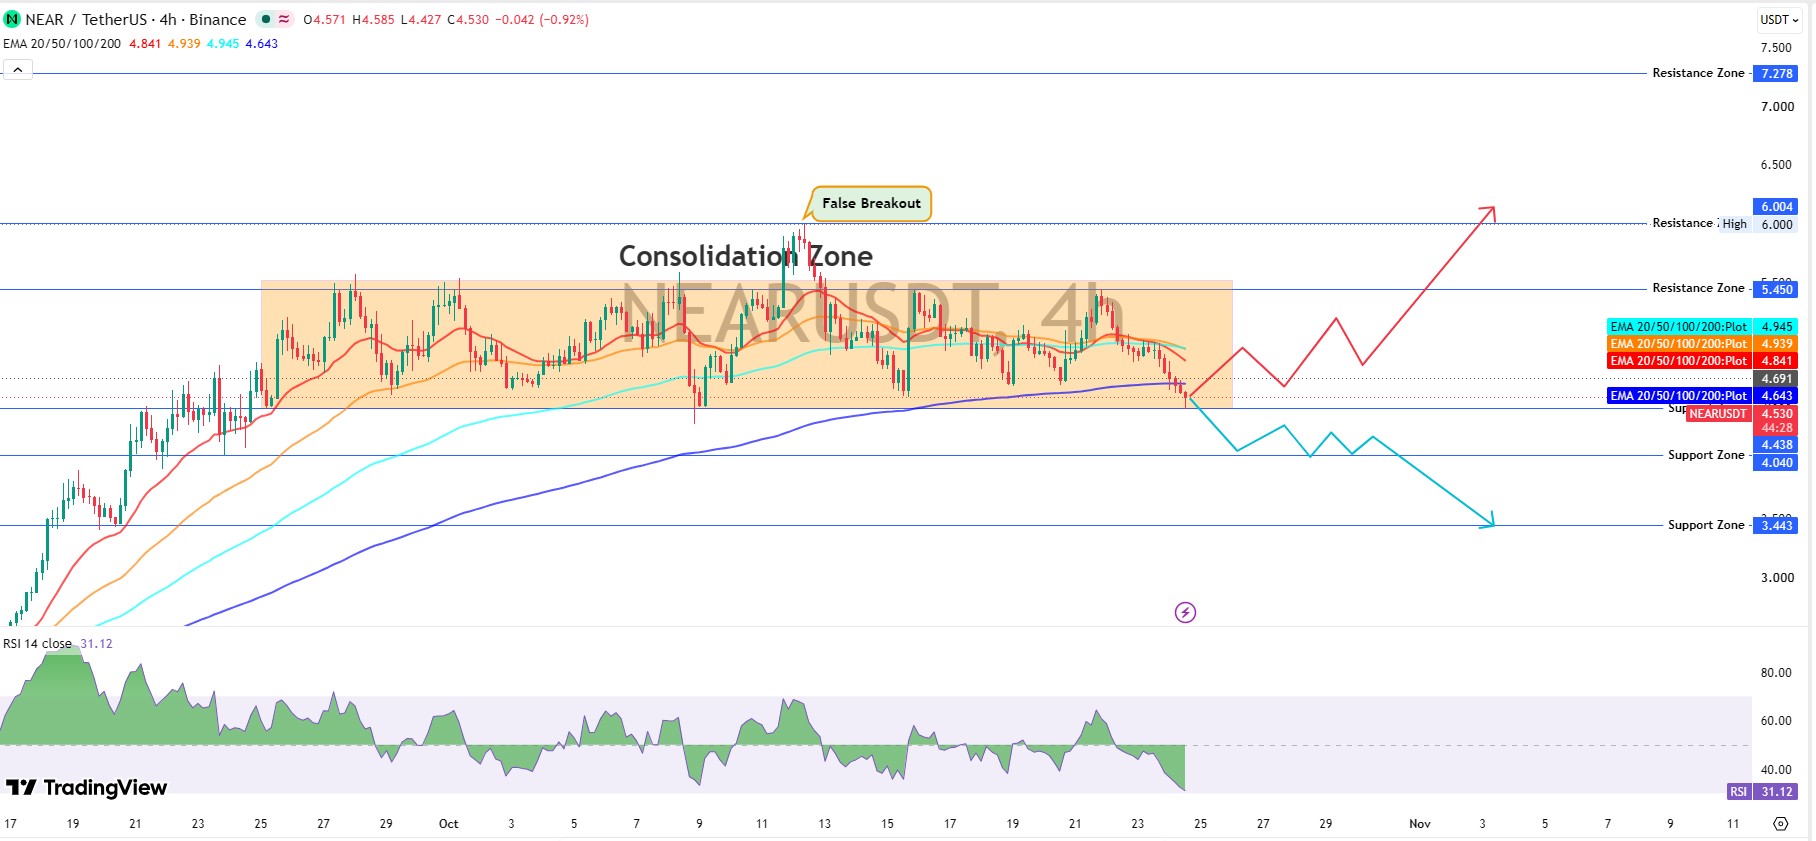
This NEAR technical analysis uses the 4-hour NEARUSDT chart on Binance, built with TradingView charts.
The 200 EMA sits at $4.643, the 20 EMA at $4.841, the 50 EMA at $4.939, and the 100 EMA at $4.945. Price is trading below all four.
That's a bearish stack.
On the chart, the consolidation zone, a sideways range where buyers and sellers cancel each other out. It runs from $4.438 to $5.450 and has held since Sept 25.
A callout near $6.00 marks a false breakout, meaning a push above a level that fails fast. Price spiked there around Oct 12, then slid back into the box.
RSI reads 31.12, near the oversold zone below 30. A bounce seems likely. Actually, scratch that, since RSI can stay weak for days while price keeps sliding.
When RSI sits near 31, bounces tend to be sharp but short.
NEAR Support and Resistance Levels That Matter
Price has traded inside a consolidation zone since Sept 25, a sideways range where buyers and sellers cancel each other out.
NEAR support and resistance stack up like this: support at $4.438, $4.040, and $3.443, with resistance at $5.450, $6.004, and $7.278.
A false breakout, meaning a push above a level that fails fast, hit around $6.00 on Oct 12. And that trap still hangs over the chart. For the upper range, the $5.59 resistance test review adds context.
Breaking: NEAR Tests the Range Floor
Price is $4.53. The floor sits at $4.438. That's roughly 2% away. Sellers are in control.
RSI reads 31.12, volume is up 12.1%, and derivatives traders already felt it. Nothing says buy yet.
Derivatives Data: Longs Took the Hit
NEAR liquidations are forced exits of positions that traders opened with borrowed money. Coinglass derivatives data shows $10.47M liquidated in 24 hours.
Longs, meaning bets on higher prices, made up $9.64M of that. Shorts lost only $825.03K.
Futures volume hit $1.81B against $282.43M in spot, so borrowed money drives this tape.
The NEAR long/short ratio on Binance sits at 1.2578, so more accounts lean long than short.
Because longs are crowded. Any dip forces more exits. So who's left to buy if those longs keep getting flushed?
NEAR ETF Inflows Offer a Quiet Cushion
An ETF, short for exchange-traded fund, holds an asset and trades like a stock.
Per the SoSoValue ETF tracker, the Bitwise NEAR spot ETF took in $992.69K on Oct 23 UTC, lifting cumulative NEAR ETF inflows to $88.26M. Net assets sit at $83.39M, about 1.32% of NEAR's market cap.
And inflows have now stacked up three days straight after a $2.54M outflow on Oct 20. Steady, not explosive. That's a cushion, not a floor.
NEAR AI Cloud Adds Fresh Fundamental Support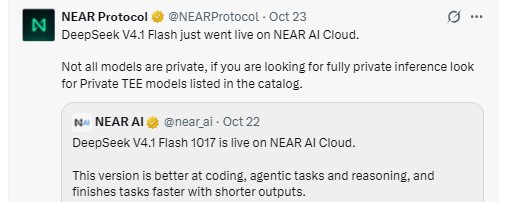
On Oct 23 UTC, NEAR Protocol on X said DeepSeek V4.1 Flash is live on NEAR AI Cloud.
That model targets coding, agentic tasks, and reasoning with shorter outputs. Fully private inference stays limited to Private TEE models, which run inside protected hardware.
Usage grows slowly, though. Price rarely reacts on day one.
NEAR Hackathon Starts Nov 1 as a Slow Catalyst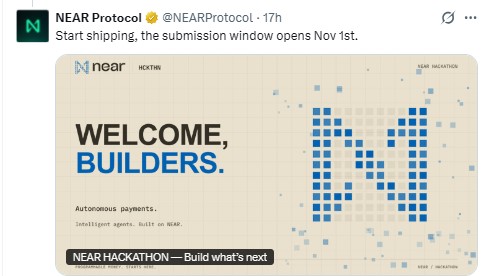
The hackathon submission window opens Nov 1, 2026, according to the team's post.
Builders ship apps, apps bring users, and users bring fees. That chain takes months.
And a NEAR hackathon that is distant won't rescue a breakdown this week.
NEAR Protocol Price Prediction Scenarios
Three paths stand out. Each carries a trigger, a target, and an invalidation, the level that proves the idea wrong.
Scenario | Trigger | Target | Invalidation | Liquidity Conditions |
Bearish breakdown | Trades below $4.438 and holds | $4.040, then $3.443 | Reclaims $4.691 | Long liquidations keep rising, spot demand stays thin |
Range chop | Trades between $4.438 and $4.691 | $4.643 to $4.841 | Breaks either side with volume | ETF inflows steady, volume near $848.27M |
Bullish recovery | Reclaims $4.643, then $4.945 | $5.450, then $6.004 | Trades below $4.438 | Shorts squeezed, spot flows turn positive |
Bullish Case: Reclaiming $4.643 Opens the Range
Bulls need the price back above the 200 EMA at $4.643. Then the cluster from $4.841 to $4.945 becomes the next wall.
Rising on-chain activity, like the NEAR intents volume rally, could supply that push. Reaching $5.450 would be the first real proof.
Bearish Case: Losing $4.438 Targets $4.040
If $4.438 gives way. Then $4.040 comes into play, followed by $3.443.
That's the base case until buyers reclaim $4.691.
Long term, a bigger upside thesis still sits far above, since the all-time high is $20.42 and the price trades 77.9% below it.
Final Verdict on NEAR Price Direction
In the short term, the NEAR Protocol price prediction leans bearish below $4.691, with $4.040 as the first real downside test.
RSI near 31 and steady ETF buying argue for a bounce. But any bounce into $4.643 meets sellers first. More setups sit in the crypto price prediction hub.
Disclaimer: This article is for information only and isn't financial advice. Crypto trading carries high risk, and prices can move fast. Independent research is essential before any decision.
0
0


 Manage all your crypto, NFT and DeFi from one place
Securely connect the portfolio you’re using to start.


