
Chainlink Price Prediction: Will Gold Token News Push LINK $12?

0
0

Can a gold-backed token headline stop LINK from sliding under $11.20?
LINK traded at $11.30 at 09:27 UTC on October 27, 2026, down 1.3% in 24 hours. This Chainlink price prediction stays bearish below $11.42, and the earlier November outlook set the wider range.
The LINK price today also sits under every EMA on the hourly chart.
Chainlink Price Prediction Meets a Gold Token Headline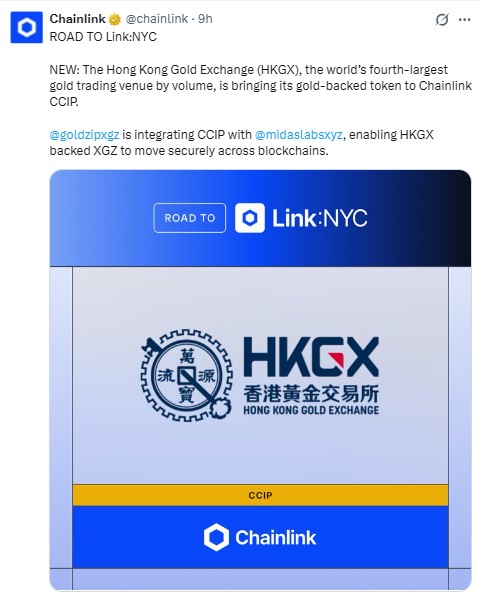
Fresh from Chainlink's X account. The Hong Kong Gold Exchange (HKGX), the world's fourth-largest gold trading venue by volume, is bringing its gold-backed token to Chainlink CCIP, the project's cross-chain messaging protocol.
Goldzip is integrating CCIP with Midas. HKGX-backed XGZ gets to move across blockchains.
Price barely flinched. LINK held between $11.26 and $11.59 across 24 hours, with no spike and no flush.
The post carries a Road to Link:NYC tag. Adoption stories need time to show up in price, and the Japan Fulcrum news sits in that same queue.
LINK Price Today and Market Data at 09:27 UTC
CoinMarketCap data ranks Chainlink 13th with an $8.45B market cap, down 1.3%.
Volume reached $265.25M, up 28.41% from the prior day and equal to 3.16% of market cap. At first, that jump read like accumulation. On second thought, price fell as volume rose, so sellers did the work.
Fully diluted value sits at $11.3B, with 748.09M LINK circulating out of a 1B maximum.
LINK trades 78.58% below its $52.88 all-time high from May 10, 2021 UTC.
Chainlink Technical Analysis on the Hourly Chart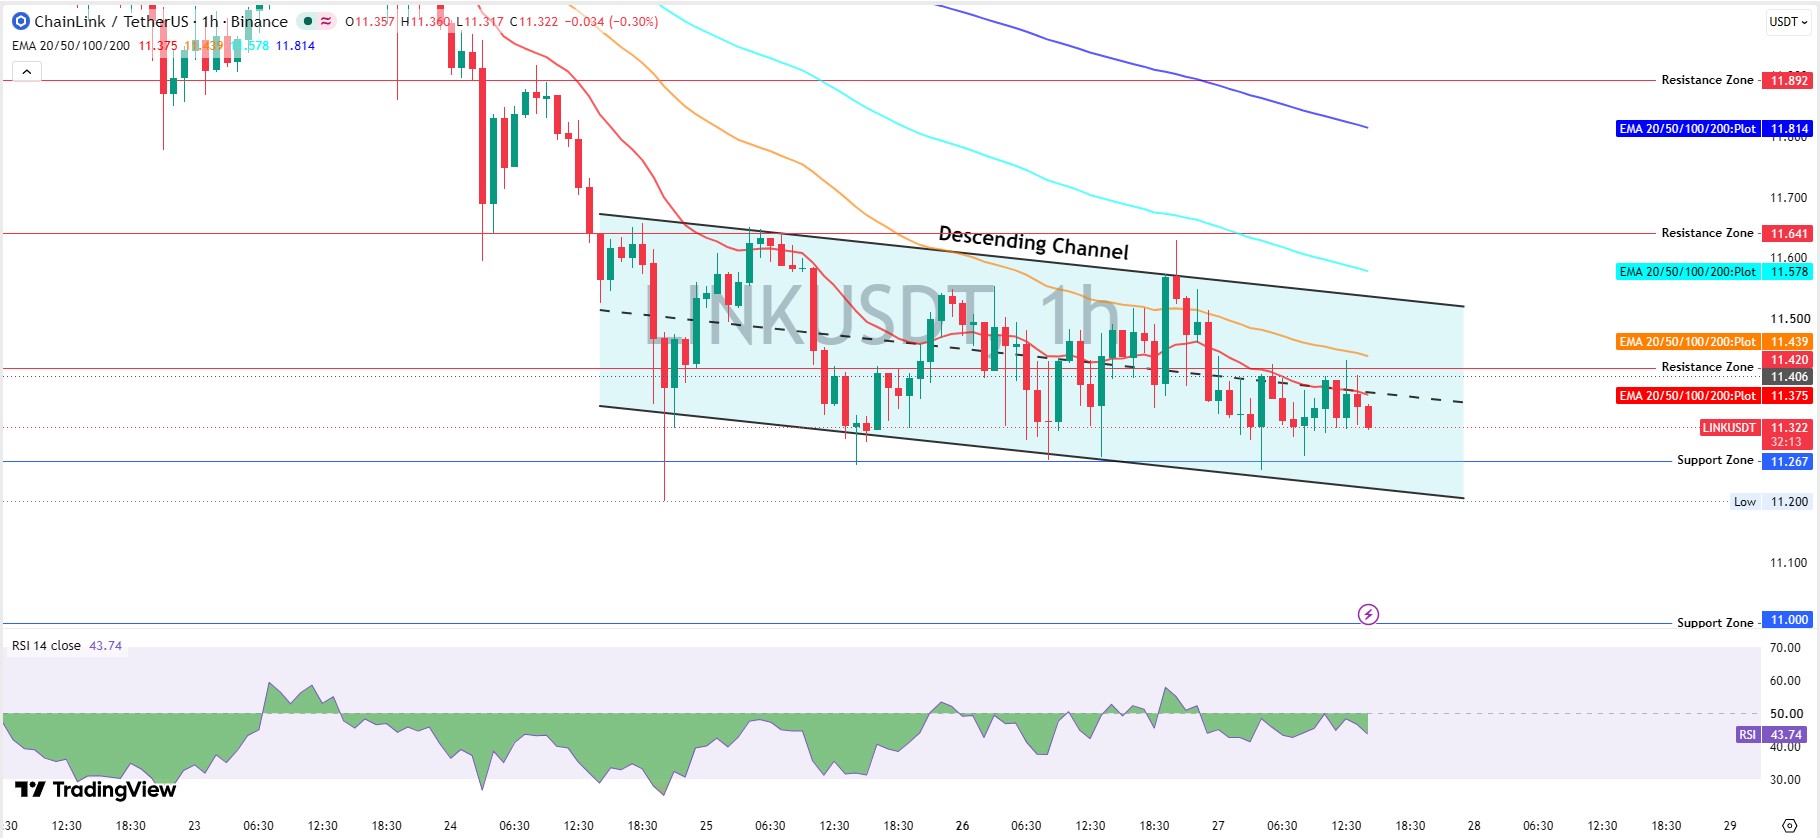
Descending Channel and RSI
On the TradingView hourly chart, LINKUSDT on Binance has traded inside a descending channel since October 24, 2026 UTC. That means two falling trendlines, with lower highs and lower lows.
RSI, a 0 to 100 momentum gauge, reads 43.74. Weak, yet far from oversold.
But a reading that high means sellers haven't exhausted themselves. The room remains.
EMA Stack Overhead
EMAs are moving averages that weight recent trading harder. The 20 EMA sits at $11.375, the 50 EMA at $11.439, the 100 EMA at $11.578, and the 200 EMA at $11.814.
Price trades under all of them, in a clean bearish order. The next hurdle is the 20 EMA at $11.375, just 0.5% above the current price.
And the oversold breakdown call flagged similar weakness earlier.
LINK Support and Resistance Levels
Support Zones
Buyers defended $11.267 on the hourly chart, and the 24-hour low sits at $11.26. Below that, $11.20 marks the recent swing low, and $11.00 is the round-number floor.
An hourly trade under $11.20 opens $11.00. Dip buyers behind the earlier reserve buy bounce would have to return here.
Resistance Zones
Sellers wait at $11.406 to $11.420, near the channel midline and both short EMAs. Then come $11.641 and $11.892.
But the $12.47 level from the earlier channel breakout setup now sits 10.4% overhead.
Futures Traders Lean Long Into the Slide
CoinGlass derivatives data shows 24-hour futures volume at $379.52M against $56.79M in spot, roughly 6.7 times higher. Open interest stands at $563.69M.
Long/short account ratios read 1.5773 on Binance and 2.91 on OKX. Top Binance traders hold 2.2678 longs per short by positions.
Longs lost $142.15K in 24 hours against $54.51K for shorts. Crowded longs under a falling channel set up more. Flushes, mostly.
Short Windows Weaken, Long Windows Hold
CoinGlass performance tiles show $LINK down 5.81% over 7 days and 19.86% over 30 days. Year-to-date sits at -6.93%, and the 1-year return is -38.82%.
But 90-day and 180-day returns stay green at +34.63% and +24.41%. Higher-timeframe buyers still hold gains, which is why dips attract bids.
$LINK ETF Flows Stay Flat
SoSoValue ETF data shows $0 net inflow on October 26, 2026 UTC, the 6th flat session in a row. Cumulative inflow holds at $179.23M.
Net assets fell to $201.59M from $211.08M on October 23, 2026 UTC. Price did that, not outflows.
These two spot ETFs, Grayscale's GLNK at $144.48M and Bitwise's CLNK at $57.12M, fell 4.74% and 5.36% on the day.
So who buys a falling coin on a headline alone?
Whale Wallets Hold the Real Weight
Etherscan holder data counts 915,697 LINK holders. Whale-tier wallets number 3,988, only 0.44% of holders, yet they hold 90.53% of market cap.
The top 100 addresses control 60.81%, and 14 holders own at least 1% each. The Community Staking Pool alone holds 40.88M LINK, or 4.09%. A big wallet isn't always a seller, but a few of them could. Move the book alone.
Bitcoin Sets the Tone for Altcoins
Bitcoin traded at $79,555.57 at 09:27 UTC, down 1.1% in 24 hours, on $25.35B in volume that rose 37.94%. The market dip outlook covers the earlier leg lower.
American spot ETFs added $110.34M to Bitcoin on October 26, 2026, but pulled $88.58M from Ethereum. Mixed flows, no broad appetite for risk.
Chainlink Price Prediction Scenarios for the Next 24 to 72 Hours
The bearish path carries the most weight. None of these paths is guaranteed.
Scenario | Trigger | Target | Invalidation | Liquidity Condition |
Bearish | Hourly trade below $11.20 | $11.00 | Hourly trade back above $11.42 | Thin bids, futures-led selling |
Base | Trades hold between $11.20 and $11.42 | $11.27 to $11.42 | Trade outside either edge on rising volume | Volume near $265M, ETF flow flat |
Bullish | Hourly trade above $11.64 | $11.89, then $12.47 | Hourly trade back below $11.42 | Rising volume, ETF inflows return |
Can $LINK Reach $12?
Can LINK reach $12 this week? It needs a 6.2% climb from $11.30, plus clean breaks of $11.64 and $11.89 on rising volume.
A bigger headline, such as the earlier LG CNS partnership, could add fuel. The gold token news didn't.
Risks to the $LINK Price Outlook
An hourly trade under $11.20 hands control to sellers, and futures-heavy volume speeds the move.
Concentrated supply adds a second risk. The whale holders analysis explains why a few large wallets move thin books.
And a Bitcoin sell-off drags altcoins faster than any CCIP headline lifts them.
Bottom Line for the Chainlink Price Prediction
Bearish below $11.42 on the hourly chart. A reclaim of $11.64 with rising volume would be the first real sign that sellers are losing grip.
Gold tokens on CCIP are a genuine adoption story, but with ETF flows flat and longs crowded, price decides first.
Disclaimer: This article is for informational purposes only and isn't financial advice. Crypto prices are volatile, and targets aren't guaranteed. Research independently before trading.
0
0

 Manage all your crypto, NFT and DeFi from one place
Securely connect the portfolio you’re using to start.


