
Fusionist Price Prediction Today: ACE Rockets Off a Fresh Crash Low

0
0

Something unusual is happening with Fusionist, and most traders searching for a Fusionist price prediction did not see it coming. A token fading for months just forced a wave of confident bears to run for the exit, and the question everyone is asking is whether this is the start of something real or another trap.
GameFi tokens have burned plenty of people who bought a bounce too early, and this one carries its own baggage, heavy insider allocations, and a brutal fall from its early glory. Something shifted fast enough that even skeptics are paying attention now.
Why Is Everyone Suddenly Talking About Fusionist Again?
Searches for Fusionist price predictions are spiking today after ACE staged one of the sharpest reversals in the small-cap crypto market this month.
Traders who had written this token off are suddenly paying attention again, and for good reason. A move like this does not happen quietly, and it rarely happens for no reason at all.
Fusionist has a real product behind it: a live game, its own chain, and a community that never fully left. But it also carries real baggage, heavy insider holdings, a rough couple of years, and a chart that spent most of 2026 making lower highs.
So what changed? Was this buyers' stepping in with genuine conviction, or something more mechanical, forcing hands rather than fresh belief?
We went through the chart, the order flow, and the wallets behind this move to figure out which one it actually was and what it means for where ACE goes from here. Ready to see what the data says?
Key Takeaways
-
Direction: Short-term momentum is bullish, but the move looks squeeze-driven rather than demand-driven.
-
Why it moved: Heavy short liquidations, not a confirmed news catalyst, lined up with the breakout.
-
Short-term range: Roughly $0.09 to $0.19, with $0.062 as the line that breaks the thesis.
-
Invalidation: A daily close back under $0.0619, the recent all-time low, flips this bearish again.
Coin Overview
Fusionist is the studio and ecosystem behind ACE, built around a live, playable mech-battler game that actually shipped on Steam and the Epic Games Store, something few Web3 gaming projects have managed.
ACE works as the gas and in-game currency on the Endurance network, the project's own chain, and it's also tracked for trading on BNB Smart Chain. The token launched with a 147M max supply, of which 104.67M ACE is circulating, per CoinMarketCap.
Vesting for team and investor allocations continues into 2027, so it's worth checking a crypto unlock calendar before trading around any single unlock date.
ACE ranks outside the top 800 by market cap and has traded as high as $17.95 in December 2023 and as low as $0.06184 just one day before this current move. Contract address (per CoinMarketCap): 0xc27A719105A987b4c34116223CAE8bd8F4B5def4.
What Actually Happened
Data as of July 20, 2026, per TradingView, unless noted. Speculative content, not financial advice.
Here's the thing: there's no obvious headline behind this spike. No listing, no partnership announcement we could verify.
What we can verify is liquidations. CoinGlass shows $867.96K in ACE liquidations over 24 hours, and $652.59K of that came from short sellers getting forced out. The 12-hour window alone saw $651.61K in short liquidations. That's a squeeze, not a fundamentals rerating.
Prices had been grinding down for months. ACE hit an all-time low of $0.06184 on July 19, just a day before this rally started. Shorts had piled in on the way down. When the price ticked up, stops triggered, and shorts covered, and that buying fed on itself.
So where does that leave ACE right now? Trading around $0.1466, up roughly 128% in 24 hours.
Key support sits near $0.0850, the old channel resistance that just flipped, with a harder floor at the $0.0619 low.
Resistance is $0.1928 and then $0.2216.
The base case is a pullback toward $0.09-$0.11 before any real push at $0.19.
The bull case needs a weekly close above $0.15.
The bear case breaks back under $0.062, the level ACE touched just one day before this move.
Basically, thin order books plus crowded shorts equals violent moves in both directions. That cuts both ways. If you're wondering whether this ties into a wider move, our crypto market rally breakdown covers what's lifting risk assets more broadly today.
Technical Chart Analysis
On the daily chart, tracked through live ACE price charts, ACE broke clean out of a descending channel that had capped price since May. The breakout candle alone moved from $0.084 to a high of $0.150.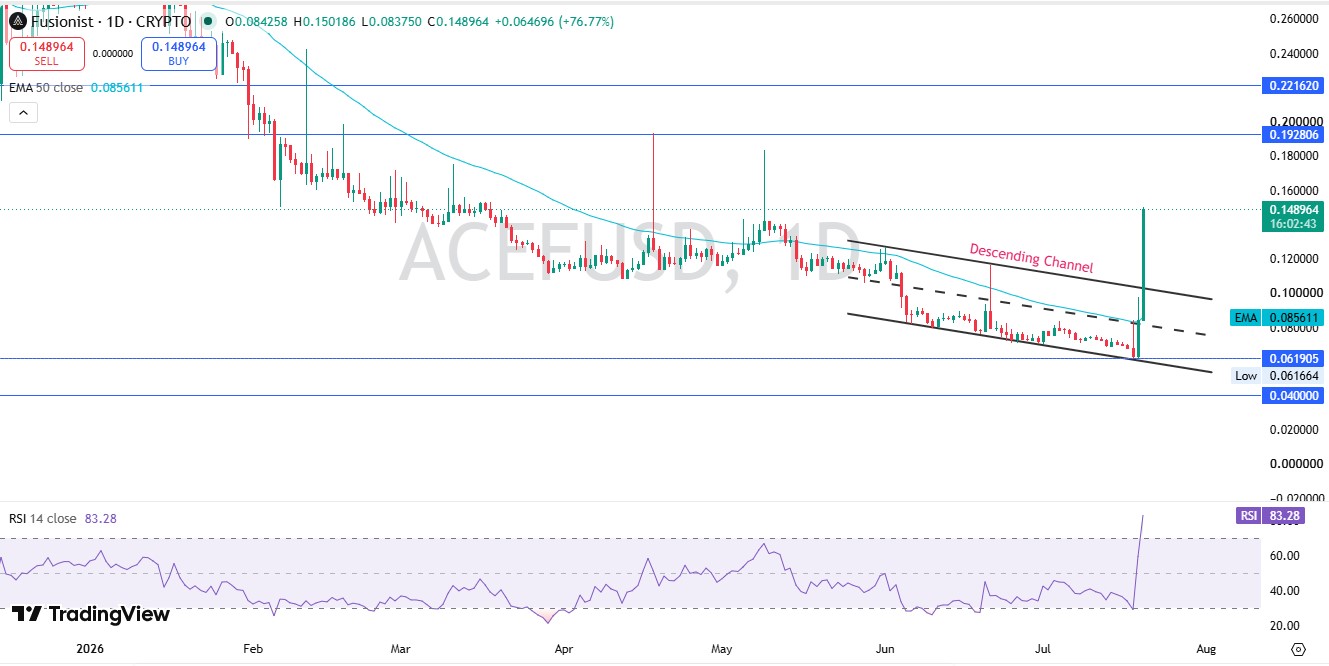
RSI (a momentum gauge that flags overbought above 70) sits at 83.28 on the daily. That's stretched. Historically, RSI this hot doesn't hold, and a cooldown toward the 50-EMA near $0.086 wouldn't be unusual.
The weekly chart tells a calmer story. Weekly RSI is 48.11, still neutral. And the weekly 50-EMA sits way up at $0.404, a reminder of how far this token has fallen over the past two years.
So the daily says overheated. The weekly says there's room. Both are true at once. For a sense of how majors are structured right now, see our Bitcoin bull bear outlook.
On-chain: concentration is the real risk
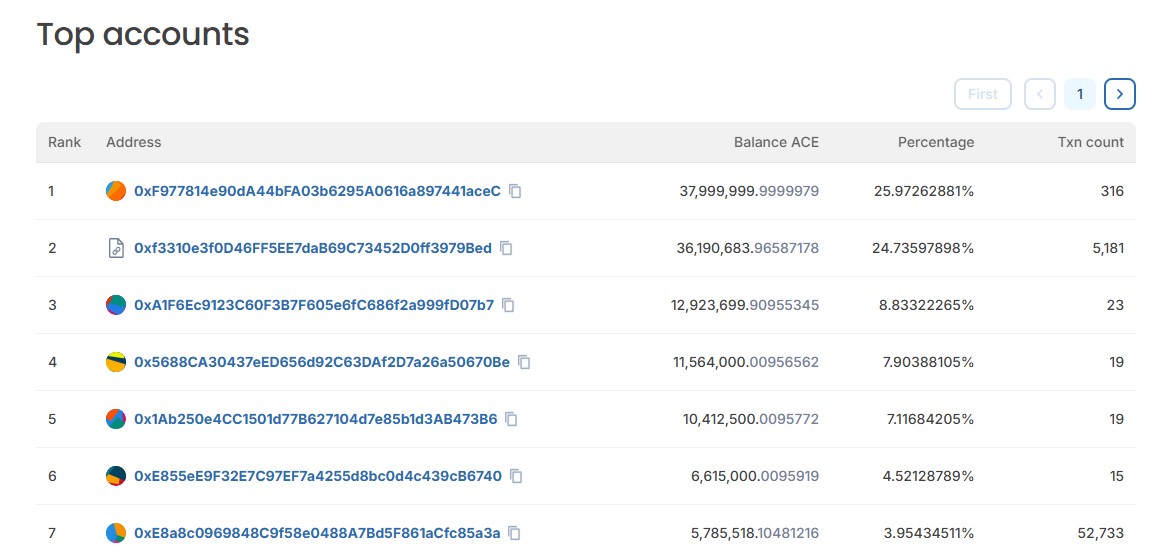
We pulled the top holder list, and it's lopsided. The top wallet holds 25.97% of supply. The second-largest address, likely a contract given its 5,181 transaction count, holds another 24.73%. Combined, two addresses control just over half of all ACE in circulation.
The holder count sits at 13,630, per CoinMarketCap. That's a small base for a token now doing over $100M in daily volume.
One thing worth noting on its own: a wallet at rank seven shows 52,733 transactions, way out of line with its 3.95% balance. That pattern usually points to a router or liquidity contract, not a person accumulating. You can pull the live rankings yourself on the Endurance chain explorer.
Fundamentals: this is a live game, not just a ticker
Fusionist isn't vaporware. It's a mech-battler game actually shipping on Steam and the Epic Games Store, which is rare for a web3 title. The studio built it independently, using the Unity engine with HDRP rendering to hit that AAA visual bar.
ACE works as gas and in-game currency on Endurance, the project's own chain, and the token is also tracked as trading on the BNB Smart Chain. Recent player-reward campaigns like "Blueprint Fortune" were designed to pull users back in and generate real token demand tied to gameplay, not just speculation.
And that's the tension here. Game adoption is a genuine long-term demand driver. But it competes against ongoing token unlocks. It's a dynamic playing out across altcoin price action generally this cycle, not just here.
Tokenomics and supply risk
The circulating supply is 104.67M ACE against a 147M max, per CoinMarketCap market data. FDV sits at $21.56M versus a $15.35M market cap, so full dilution isn't priced in by much, which is mildly reassuring.
Unlock risk is real, though. Vesting for team and investor allocations runs into 2027. One tracked unlock released roughly 2.85M ACE, about 1.94% of max supply, in mid-July. Don't assume that pressure is gone. Confirm the next unlock date before trading around it.
Scenarios by timeframe
| Timeframe | Bull Case | Base Case | Bear Case |
|---|---|---|---|
| Short-term (days) | Holds above $0.13, squeezes toward $0.19 as shorts capitulate further | Cools to $0.09-$0.11, RSI resets, chop continues | Fails at $0.10, retests $0.062 low |
| Weekly | A weekly close above $0.15 flips trend structure bullish | Range-bound $0.08-$0.16 inside the old channel | Breaks $0.062, weekly downtrend resumes |
| Monthly | Sustained volume plus game-driven demand pushes toward $0.22-$0.32 | Drifts back toward the $0.10-$0.14 zone as squeeze fades | Unlock-driven selling drags price under $0.06, new low |
| Long-term (speculative) | Game adoption and Endurance chain activity support a slow climb toward prior support near $0.32-$0.40 | Price stays rangebound well below ATH as supply and adoption offset each other | Weak player retention plus continued unlocks keep ACE grinding toward its lows |
Long-term numbers here are assumption-heavy. They lean on player growth actually happening. Treat them as a framework, not a promise.
Historical context
ACE peaked near $17.95 back in December 2023. It's now down about 99% from that high. That ATH came during a very different market, before the bulk of today's supply had even unlocked, so a direct comparison isn't fair to either number.
The token also just printed a fresh all-time low, $0.06184, on July 19. Being 24% above your ATL after a squeeze isn't the same as being in a confirmed uptrend.
Risks to watch
Whale concentration tops the list. Two wallets holding over half of the supply means either one can move the price hard. Futures-led speculation is another; the $268.58M in 24-hour futures volume dwarfs the $36.25M in spot, per CoinGlass, so this move is leverage-driven more than organic buying.
Binance carries the bulk of trading volume at $157.75M, per CoinGlass's exchange heatmap, so any issue there would hit liquidity fast. Worth tracking through our crypto exchange coverage if you're active on any single venue. Add ongoing unlock schedules and thin order books, and volatility isn't going anywhere.
Methodology
Levels came from daily and weekly TradingView charts (ACEFUSD), using the 50-EMA, RSI-14, and visible channel structure. Supply and market data came from CoinMarketCap. Liquidation and volume-by-exchange data came from CoinGlass currency data.
Holder concentration came from the ACE block explorer's top-accounts list. All figures were checked against the screenshots provided and are timestamped July 19-20, 2026. Long-term targets are directional and assumption-dependent, not price guarantees.
Disclaimer: This is speculative market commentary, not investment advice. Crypto assets are volatile and can lose most or all of their value. Do your own research before trading.
0
0
 Manage all your crypto, NFT and DeFi from one place
Securely connect the portfolio you’re using to start.