
ZClassic Price Prediction (ZCL): Can ZCL Regain Its Bullish Momentum?

0
0

A quiet chart just turned loud, and traders who ignored it for months are suddenly paying attention. Nobody saw this coming. This ZClassic price prediction breaks down whether the move can hold.
ZCL Price Prediction Today: Is the ZClassic Rally Sustainable?
Every fresh ZCL price prediction starts with one blunt fact: a coin that barely traded for months just exploded higher in a single session. For long-time holders, it feels like vindication. For everyone else, it feels like missing the boat.
Similar setups show up often in broader price prediction coverage of smaller-cap tokens: thin liquidity, then a violent breakout. Momentum traders are chasing it. Value holders are waiting on a pullback that may never come. So where does that leave anyone watching, wondering if the rally has legs or if it's already borrowing against tomorrow?
Quick Prediction Box
Metric | Current View |
ZCL Price | $2.11 (as of 04:17 UTC, September 15, 2026) |
Trend | Bullish, but stretched thin |
Short-Term Target | $2.53 to $4.06 |
Support | $1.20 (immediate), $0.35 (major) |
Resistance | $2.53 (immediate), $4.06 (major) |
RSI | 97.95 (extremely overbought) |
Bull Case | $4.06 to $11.45 |
Base Case | $1.20 to $2.53 |
Bear Case | $0.35 to $0.80 |
Invalidation | Below $0.35 with rising volume |
ZClassic Price Prediction Today
ZCL trades near $2.11 as of 04:17 UTC on September 15, 2026, based on live market data. The 24-hour range runs from roughly $0.45 up to $2.51.
Market cap sits close to $22.7 million. That's thin by any standard.
24-hour trading volume comes in just over $110,000. Trading a coin this size means one large order can move the whole chart.
RSI reads 97.95. That's not just overbought; it's about as stretched as the indicator ever gets. Volatility is the word of the day.
ZClassic Technical Analysis
The chart tells a story most low-cap tokens never get to tell. Months of sideways trading gave way to one violent breakout candle, and that changes how this setup should get read.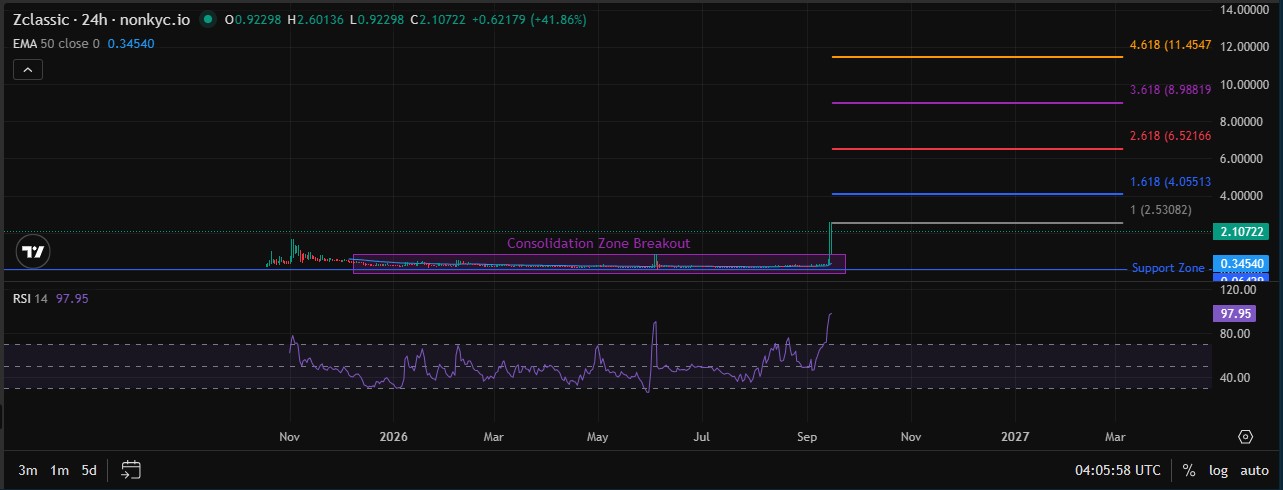
ZCL Trend Analysis
Price structure flipped from range-bound to a clear pattern of higher highs and higher lows the moment trading pushed above the old consolidation ceiling. The 50-day EMA sits near $0.35, far below where trading happens now.
That gap between price and the moving average is unusual. It rarely lasts long.
ZCL RSI Analysis
RSI at 97.95 sits about as extreme as readings get. Anything above 70 usually flags overbought conditions, and this reading is well past that line.
No bearish divergence shows up yet, since the move is still fresh. But an RSI this hot rarely holds without some kind of cooling-off trade.
ZCL MACD Analysis
The MACD line sits at 0.16768 against a signal line of 0.24893, with the histogram reading 0.08125. That's a bullish setup; momentum keeps building rather than fading.
Turns out, the crossover lines up almost exactly with the breakout candle. That timing isn't something traders should ignore.
ZCL Volume Analysis
This part matters more for ZCL than most coins. Trading volume during the breakout spiked well above levels seen during the prior consolidation phase.
But total daily volume across venues like the ZCL/USDT trading pair still adds up to just over $110,000. A breakout backed by real volume deserves more trust than one without. This one has some. Not a flood.
ZCL Support and Resistance Levels
Immediate Support
The first line of defense sits near $1.20, close to where the breakout candle opened. A trade back below that level would suggest the move is losing steam fast.
Major Support
Further down, the $0.35 zone lines up with both the old consolidation range and the 50-day EMA. Losing this level would undo the bullish structure built over the past year.
Immediate Resistance
The first Fibonacci extension target lands near $2.53. Bulls need to clear this with real conviction, not just a brief wick.
Major Resistance
Beyond that, $4.06 marks the next major extension level. Clearing resistance on rising volume confirms the bullish case. Falling below support risks confirming the bearish one.
ZClassic Bull, Base and Bear Scenarios
Scenario | Target | Conditions |
Bull | $4.06 to $11.45 | Breakout holds, volume keeps rising, trading clears $2.53 |
Base | $1.20 to $2.53 | Range continuation, sideways chop, no fresh volume |
Bear | $0.35 to $0.80 | Support breakdown, volume dries up, RSI cools hard |
None of these numbers come from guesswork. Each scenario ties directly to whether trading volume shows up when it counts.
ZClassic Price Prediction 2026
The rest of 2026 likely hinges on whether this breakout gets confirmed or rejected within the next few weeks.
2026 Bull Case
A confirmed breakout with sustained trading volume could push ZCL toward the $4.06 to $11.45 zone before year-end.
2026 Base Case
A cooling-off period that holds above $1.20 keeps the token range-bound between $1.20 and $2.53 for the remainder of the year.
2026 Bear Case
A failed breakout that slides back under $0.35 would likely send ZCL retesting levels closer to its prior range lows.
ZClassic Price Prediction 2027
By 2027, the setup depends less on this week's candle and more on whether the project sees renewed development or exchange activity. A bullish close to 2026 sets up a run toward the higher Fibonacci extensions, with a target range of $6.52 to $8.99.
A bearish close, on the other hand, likely means another long consolidation phase, with price stuck closer to $0.80 to $1.20, before any real progress shows up.
ZClassic Price Prediction 2028
Three years out, low-cap tokens like this one tend to follow the wider crypto market cycle more than their own fundamentals. A strong market cycle could support prices in the $8.99 to $11.45 range, well above current resistance. A weak one could erase most of this year's gains and pull the price back toward $0.50 to $1.00.
ZClassic Price Prediction 2029
Predicting an exact number for 2029 stretches past anything technical analysis can responsibly support. A rough bullish band sits near $10 to $15, while a bearish band sits closer to $0.60 to $1.50. What can get said with more confidence: liquidity and exchange support will matter more than any chart pattern by then.
ZClassic Price Prediction 2030
By 2030, ZCL's fate probably rests on whether the network still has active developers and a listed presence on relevant exchanges. A bullish outcome could see the price test $15 to $20. A bearish outcome could see it fall back under $1. Price predictions this far out carry heavy uncertainty. Treat any specific number with real skepticism.
What Could Drive ZCL Higher?
Crypto Market Conditions
A broader bull market tends to lift low-cap tokens harder than large-cap ones, largely through relative volume flows. Even fast-moving corners of the market, tracked through memecoin market updates, tend to show whether risk appetite is rising or fading.
Sentiment around AI-sector crypto news often moves in the same direction, and a risk-on mood across both corners usually spills over into thinly traded tokens like this one.
ZClassic-Specific Catalysts
Only catalysts that can get verified deserve a place here, and right now that shortlist stays thin. Renewed coin event activity would count toward that list, and so would any confirmed airdrop announcements tied to the network. Vague rumors don't.
Liquidity and Exchange Activity
More venues trading ZCL would ease the thin liquidity problem behind today's wild swings. Coverage of new exchange listing activity across the market gets tracked separately, and it's worth following for this token specifically.
Privacy-Coin Narrative
ZClassic's history ties into the privacy-coin conversation that shaped projects like Zcash. That narrative resurfaces occasionally, though it hasn't shown up as a clear driver behind this particular move.
ZClassic Price Risks
Low liquidity tops the list. A market cap near $22.7 million means large trades cause outsized swings.
Large price swings cut both ways, fast gains, faster losses.
Volume deterioration after a breakout often signals exhaustion, not strength.
Breakdown risk stays real below the $0.35 support zone.
Regulatory risk applies broadly across smaller tokens with thin oversight.
Development activity around the project isn't well documented publicly, and that raises ecosystem risk.
Wider crypto market drops tend to hit low-cap tokens hardest of all.
Data-quality issues showed up directly in this research. One source reported a 24-hour gain near 42%. Another reported a gain above 300% for the same window. That gap alone should make anyone pause before trusting a single number blindly.
ZCL Price Prediction Invalidation Levels
If ZCL trades below $0.35 with rising volume, the bullish structure built since the breakout weakens hard.
If ZCL clears $2.53 with rising volume behind it, the bullish target toward $4.06 becomes far more credible.
That framework beats simply naming a price and hoping it sticks.
Is ZCL a Good Investment?
No simple yes or no answer covers this one.
Bullish Factors
A confirmed breakout structure, positive MACD momentum, and a dramatic recovery from near-zero levels a year ago all favor the bulls.
Bearish Factors
Extreme RSI readings, thin liquidity, and a wide gap from the 50-day EMA all argue for caution.
Who Should Avoid ZCL?
Anyone uncomfortable with large, fast price swings should probably stay away. This isn't a token built for conservative portfolios.
What Traders Should Watch
Trading volume on any pullback matters most. A pullback on light volume favors bulls. A pullback on heavy volume favors bears. Fine. That's the whole framework.
Disclaimer: This article is for informational purposes only and does not constitute financial advice. Cryptocurrency markets carry high risk, and prices can change rapidly, especially for low-liquidity tokens like ZCL. Independent research and professional guidance are recommended before making any investment decision.
0
0

 Manage all your crypto, NFT and DeFi from one place
Securely connect the portfolio you’re using to start.