
381 days after the high: why the Bitcoin cycle is running differently this time

0
0

The Bitcoin cycle is the observation that the price has moved in a recurring rhythm since 2012: roughly every four years the reward for miners halves, a good eighteen months later a record follows, and after that comes a deep slump. Ask today whether that rhythm still holds and you get two opposing answers. Both can be checked with numbers.
The documented figures: the last three cycle highs arrived 526, 548 and 534 days after the respective halving, so within three weeks of each other, and the high of October 6, 2025 fits that pattern exactly. Equally documented is that the swing gets smaller from cycle to cycle. Our assessment follows further down: the rhythm holds, the return per cycle does not, and those two things are precisely what the debate about the supposedly dead four-year cycle mixes up. Bitcoin traded at around $84,300 on October 22, 2026, the equivalent of some 75,000 euros.
Bitcoin cycle: the key points
- The rhythm is intact: 526, 548 and 534 days separated the last three halvings from their respective cycle highs.
- The records follow at even intervals: 1,478, 1,424 and 1,426 days from high to high.
- The gain is shrinking: from high to high it was first a factor of 16.9, then 3.5, most recently only 1.8.
- The crash is shrinking with it: 86.9 percent after 2013, 84.1 after 2017, 77.6 after 2021 and so far 54.3 percent after the high of 2025.
- On October 22, 2026 Bitcoin sits 33 percent below the record. In the three cycles before it, the price was 72 to 80 percent down on the same cycle day.
- The next halving falls at block 1,050,000, which at today's block speed means March or April 2028.
What the Bitcoin cycle is: halving, block reward and the four-year rhythm
The halving is a rule hard-coded into the Bitcoin protocol: every 210,000 blocks, the amount of new Bitcoin a miner receives for a block found drops by half. Because a block appears every ten minutes on average, that takes around four years. The block reward currently stands at 3.125 Bitcoin; after the next halving it will be 1.5625.
Cycle theory grew out of that. The logic behind it: new supply halves overnight, demand stays flat or grows, the price picks up with a delay, attracts new buyers, overshoots and then slumps. Four phases, four years. The term four-year cycle refers to exactly that sequence.
What matters is what the theory does not claim. An immediate price rise after the halving is no part of it, nor is a target price. What it describes is a sequence in time. That is precisely why the theory can be checked: what gets measured are intervals, not forecasts. We keep the date overview with countdown and block height up to date on our page on the Bitcoin halving.

Four halvings, four highs: the dates are in the blockchain
Nobody has to estimate the halvings. Each one carries a timestamp in the blockchain, readable at the block in question: block 840,000, for instance, carries April 20, 2024. Alongside them the peak prices, measured against the daily prices of the Bitstamp exchange:
| Halving | Block | Reward after | Cycle high | Peak price |
|---|---|---|---|---|
| November 28, 2012 | 210,000 | 25 BTC | November 30, 2013 | $1,163 |
| July 9, 2016 | 420,000 | 12.5 BTC | December 17, 2017 | $19,666 |
| May 11, 2020 | 630,000 | 6.25 BTC | November 10, 2021 | $69,000 |
| April 20, 2024 | 840,000 | 3.125 BTC | October 6, 2025 | $126,272 |
One number needs framing: the all-time high of October 6, 2025 sits between $126,080 and $126,272 depending on the data source. The lower figure averages across many venues, the higher one is the daily peak at a single exchange. The spread changes nothing about the point.
The series holds one exception: in March 2024, still before the fourth halving, a new record had already been set at $73,794. That had never happened before, and it was the first sign that a second force is at work.
526, 548 and 534 days: the rhythm from halving to cycle high
The strongest evidence for the cycle is not a price but an interval. From the day of the halving to the highest price of the upswing that followed, this much time passed:
- after the 2012 halving: 367 days to the high of November 30, 2013
- after 2016: 526 days to December 17, 2017
- after 2020: 548 days to November 10, 2021
- after 2024: 534 days to October 6, 2025
The first value falls outside the pattern, and there is a plausible reason for that: in 2013 Bitcoin was a niche market with few venues, one in which a single buyer could move the price. The three more recent cycles, by contrast, sit close together. Twenty-two days separate the shortest interval from the longest; the average is 536.
The picture tightens further when you measure record to record instead of halving to record: 1,478 days from the 2013 high to the 2017 high, 1,424 days to 2021, 1,426 days to 2025. The last two intervals differ by two days. Each is a good 3 years and 11 months. Extend that interval and you arrive, on paper, at September 1, 2029. That is an arithmetic exercise and not a prediction, because three readings do not yet make a law.
One thing can be stated regardless: anyone who claimed in 2024 that the cycle was dead got the timing of the high wrong. It came, and it came on schedule.
A factor of 16.9, then 3.5, then 1.8: the amplitude shrinks with every cycle
On schedule does not mean equally strong. Measure each record against the one before it and the series flattens with every pass:
| From high to high | Price before | Price after | Factor | Interval |
|---|---|---|---|---|
| 2013 to 2017 | $1,163 | $19,666 | 16.9 | 1,478 days |
| 2017 to 2021 | $19,666 | $69,000 | 3.5 | 1,424 days |
| 2021 to 2025 | $69,000 | $126,272 | 1.8 | 1,426 days |
The asset manager Grayscale put the same finding differently: the strongest twelve-month gain of this cycle came to 240 percent, measured to March 2024, while earlier upswings delivered annual gains of more than 1,000 percent.
The downward move follows the same pattern. From record to the lowest point afterwards, Bitcoin lost 86.9 percent (to January 2015), 84.1 percent (to December 2018) and 77.6 percent (to November 2022). The current cycle so far shows a decline of 54.3 percent: from October 6, 2025 to July 1, 2026, when the price found its low to date at $57,735.
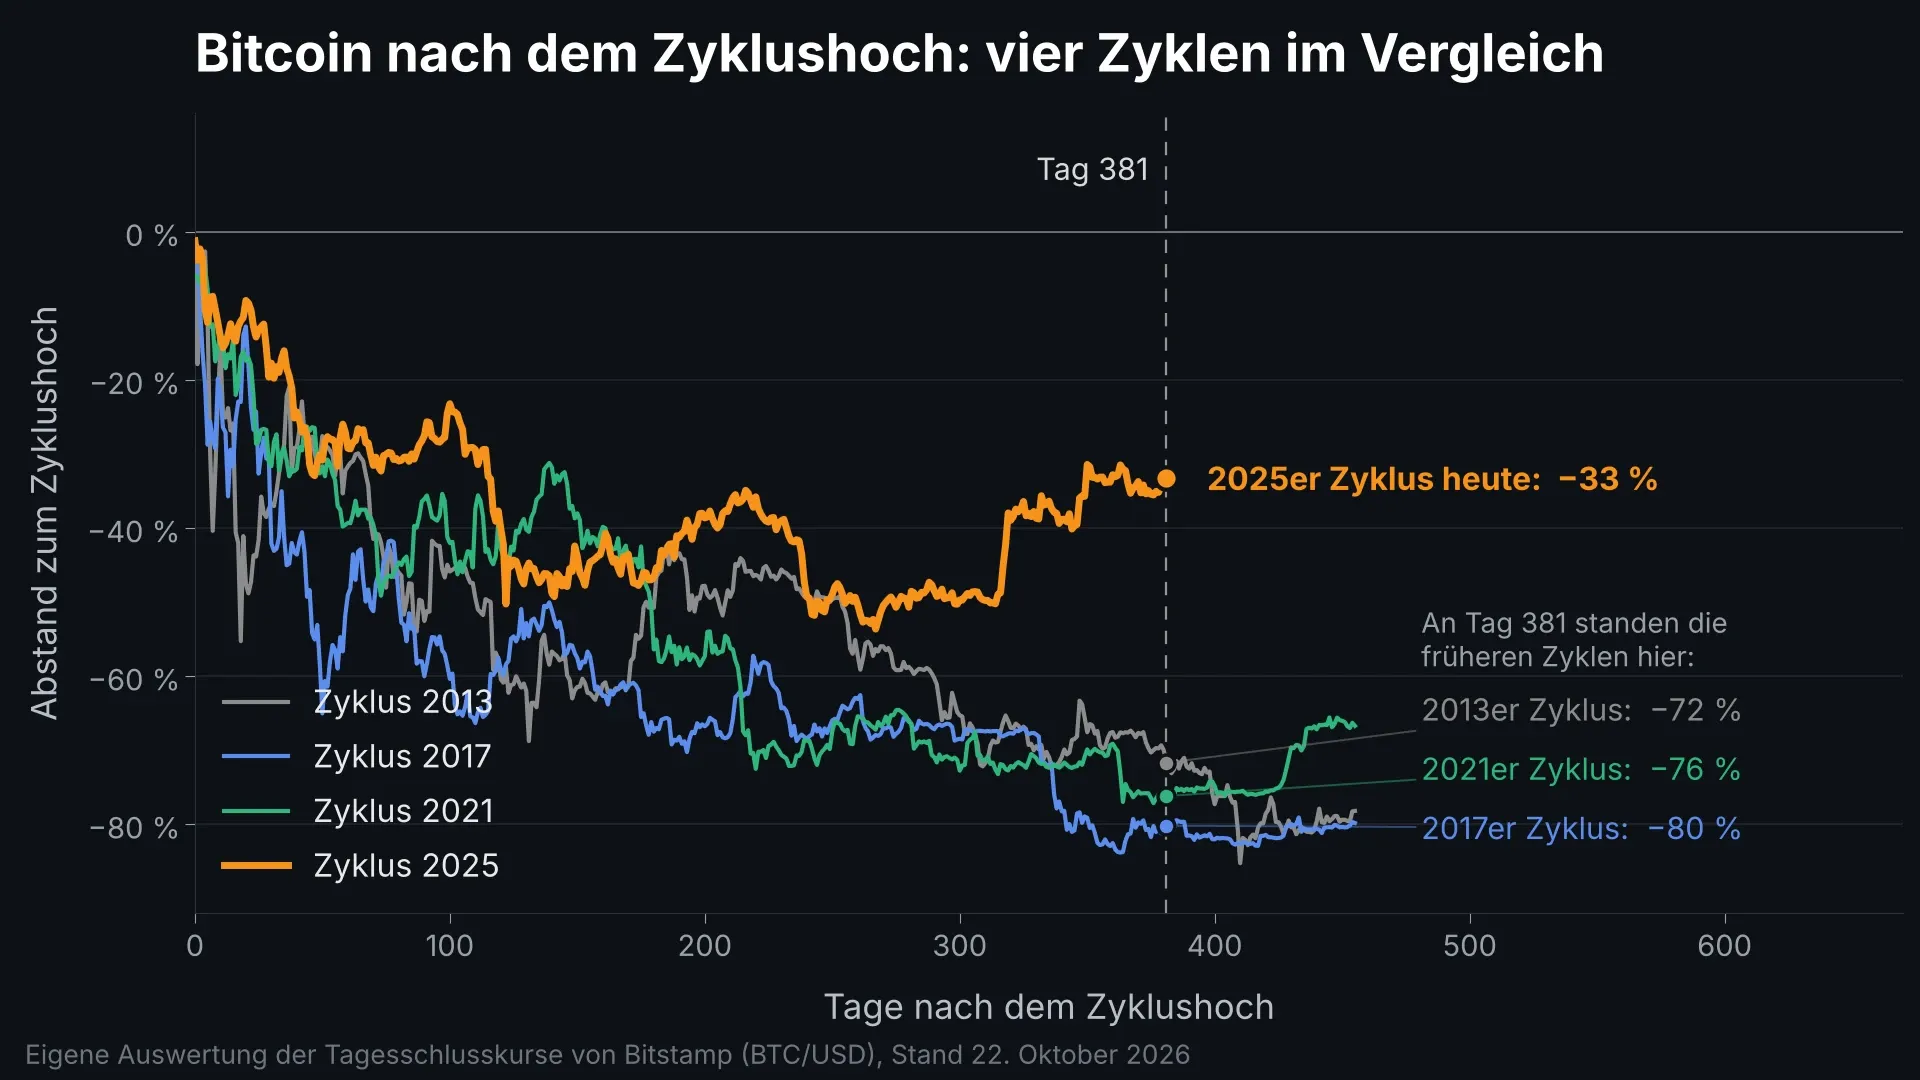
33 percent instead of 72 to 80: the direct comparison on the same cycle day
The most telling measurement in this article lays the four cycles over each other and asks where the price stood on the same day after the record. October 22, 2026 is day 381 after the high of October 6, 2025. On their respective day 381, the older cycles stood as follows:
- cycle of 2013: $329, 71.7 percent below the record
- cycle of 2017: $3,886, 80.2 percent below the record
- cycle of 2021: $16,454, 76.2 percent below the record
- cycle of 2025: $84,264, 33.3 percent below the record
The three old cycles sat between 72 and 80 percent down on that day, inside a corridor of eight percentage points. The current cycle sits more than 38 percentage points above them. In the chart above, the orange curve runs above all three predecessors across the full 381 days, and it does so without a single point of contact.
A second difference lies in the timing of the low. The earlier cycles found their deepest point 363 to 410 days after the high, which is roughly now. The low of this cycle so far sits on day 268, more than three months earlier, and the price has risen since. Whether that low holds is for the coming months to decide; a cycle is only over with the next record.
The time taken to recover has shortened as well. From high to the next record, Bitcoin needed 1,181 days (from 2013), then 1,079 days (from 2017) and most recently 846 days (from 2021). Measured against that series, the current cycle would still be mid-course on day 381. In January 2026 we had already put the same question and asked whether this crypto cycle is running like the one in 2021. Nine months on, the answer can be split: on timing yes, on the depth of the fall no.
The year 2026 itself reads as unspectacular: a peak of $97,939 on January 14, a low of $57,735 on July 1, and a loss of 5 percent since the start of the year. Since the end of July the price has moved in a range between $62,216 and $87,374. That sideways move at a moderate distance from the record is what is genuinely new about this cycle.
Supply, funds and market size: the halving's drive falls to 0.8 percent
There is an explanation for the shrinking amplitude that needs no reference to sentiment: the halving loses leverage with every pass. What counts is not that the block reward halves, but how much new supply that removes relative to the amount already in existence.
| Period | Reward per block | New Bitcoin per year | Share of circulating supply |
|---|---|---|---|
| from 2012 | 25 BTC | around 1,314,000 | around 12.1 percent |
| from 2016 | 12.5 BTC | around 657,000 | around 3.9 percent |
| from 2020 | 6.25 BTC | around 328,500 | around 1.7 percent |
| from 2024 | 3.125 BTC | around 164,250 | around 0.8 percent |
| from 2028 | 1.5625 BTC | around 82,125 | around 0.4 percent |
In 2012 the halving removed a stream of supply equivalent to a tenth of all existing Bitcoin per year. Today it is less than one percent, and after 2028 half of that. Around 450 new Bitcoin are added daily at present, against a circulating supply of a good 20.1 million. An event that touches 0.4 rather than 12 percent of the stock can hardly move the price the way it once did. That does not invalidate the cycle, but its drive is getting weaker.
Add to that the sheer size. Bitcoin was worth around $1.69 trillion on October 22, 2026. Doubling that today takes a multiple of the capital needed in 2017 to achieve the same percentage jump. And the origin of that capital has shifted: Grayscale points out that new money now arrives predominantly through exchange-traded products and corporate balance sheets rather than through private accounts at trading venues. How such products work in Germany is set out in our overview of crypto ETFs and ETNs. To follow the shift between Bitcoin and the rest of the market, we publish the course of Bitcoin dominance as a running chart.
Funds buy and sell differently from retail investors: more regularly, in larger blocks and often against the short-term trend. That is what dampens excesses in both directions. We have set the tools for tracking such inflows and outflows side by side in our overview of crypto analytics platforms.

The counter-test: what Grayscale and Bitwise had announced for 2026
In December 2025 several houses published annual outlooks declaring the four-year cycle finished. Those statements can be measured against prices today, and that belongs to an honest assessment.
Grayscale wrote in its outlook that the four-year cycle thesis would prove wrong, and considered a new all-time high in the first half of 2026 likely. Measured against the price, that expectation has not materialised: the highest level of the first half of 2026 came on January 14 at $97,939, which is 22.4 percent below the record of October 2025.
Matt Hougan, chief investment officer of the asset manager Bitwise, likewise expected new records for 2026 in his firm's annual forecasts, and based that on institutional capital whose inflow would accelerate. That expectation has not been met by October 22, 2026 either; the year is down 5 percent. In fairness: the year is not over, and a good two months remain.
Not everyone committed. Galaxy Digital called the year too chaotic for a forecast at the time. One point stands out above all: both houses that declared the cycle dead derived rising prices from it. What has happened so far is the opposite, and it has happened on a rhythm that still matches the old intervals.
Holding period and allowance: what the cycle changes for investors in Germany
By the measured intervals, a cycle lasts around 1,426 days, or just under four years. For investors in Germany that span has a tax counterpart. Private disposals of crypto assets fall under section 23 of the Income Tax Act: hold a coin for longer than a year and then sell, and no income tax is due on the gain. Sell inside the year and the gain is taxable, provided the sum of all private disposal gains in a year reaches the allowance of 1,000 euros.
That produces a connection usually missing from cycle talk: holding a position across a cycle low inevitably crosses the one-year mark. Trying to catch highs and lows, by contrast, usually means trading inside the period and landing in the tax net. The holding period is currently under political debate; we keep the latest state of play, with dates, on our page on the crypto holding period. This text is no substitute for tax advice.
For choosing a trading venue, the MiCA regulation has applied across the EU since the last transition period ended on July 1, 2026: providers need authorisation as crypto-asset service providers, supervised in Germany by BaFin. Which platforms hold that authorisation is shown in our comparison of regulated crypto exchanges.
Block 1,050,000: when the next halving falls
The fifth halving takes effect at block 1,050,000. On October 22, 2026 the blockchain stood at height 972,548, so 77,452 blocks are missing. When those are reached depends on the speed at which miners find blocks.
Across the last 2,016 blocks, meaning a full difficulty period, the interval was 9.39 minutes and therefore below the target of ten minutes. Project that pace forward and the halving falls on March 10, 2028. At the ten-minute target it would be April 11, 2028. A window in spring 2028 is therefore realistic, around 505 to 537 days from today. The more computing power joins the network, the further the date slides forward.
What would break the cycle: three conditions with a date
Instead of declaring the cycle dead or alive, it is possible to set out how a break would be recognisable. Three conditions can be checked:
- A record at the wrong time. Should the price climb above $126,272 before the halving in spring 2028, the pattern of March 2024 repeats on a larger scale. The price would then be driving the halving rather than the other way round.
- A low that is not a low. Should the level of July 1, 2026 hold until the next halving, this would be the first cycle since 2013 without a decline of more than 70 percent. The gap to the three predecessors would then exceed 20 percentage points.
- A rhythm that fails. The interval between the last three records was 1,478, 1,424 and 1,426 days. Should the next record arrive well before or well after the calculated date around September 1, 2029, the rhythm has broken.
Each of these three conditions carries a date and a number. That makes the question answerable in two years without having to rely on sentiment.
Our assessment: the rhythm holds, the return per cycle does not
From the newsroom's point of view, the debate confuses time with yield. The measured intervals argue for that reading: 526, 548 and 534 days from halving to high, plus 1,424 and 1,426 days from record to record. The timeframe has held every time so far, most recently in October 2025. At the same time the gain fell from a factor of 16.9 to 3.5 and then to 1.8, and the supply effect of the halving sank from 12.1 to 0.8 percent of circulating supply. Together that produces a rhythm of diminishing force.
Against that stands the small sample. Four cycles are four data points, and two of them come from a time when the whole market was smaller than a single large fund is today. Against it also stands the fact that the current cycle falls markedly out of line on the decline: 54 instead of 78 to 87 percent. Deriving a fixed timetable from that overstretches the data. Bitcoin remains an asset in which a total loss is possible, and none of the numbers in this article says anything about tomorrow's price.
Bitcoin cycle: around 500 days remain until the next halving
The rhythm of the cycle has held so far, the return per pass is shrinking, and the next halving lies in spring 2028. Three steps turn that into something practical:
- Match your own time horizon to the length of the cycle. Just under four years from record to record means a position held across a full cycle clears the one-year tax mark by a wide margin. If you want to buy regularly and regardless of the price level, the terms are in our comparison of Bitcoin savings plans.
- Collect the records from the first purchase onwards. Purchase date, price and venue decide later whether a gain falls inside the one-year period. Which programs take that over is set out in our overview of crypto tax tools.
- Keep an eye on the three conditions above. A record before spring 2028, a holding low from July 1, 2026, or a record far away from September 1, 2029: each of these marks says more about the cycle than any annual forecast. Our comparison of crypto exchanges shows where a coin is tradable at which fees.
(As of October 22, 2026. This article is not investment advice. Prices and fee structures change; check the terms with the provider before you buy.)
0
0

 Manage all your crypto, NFT and DeFi from one place
Securely connect the portfolio you’re using to start.
 Where will Bitcoin trade next?
Live Polymarket and Kalshi odds on Bitcoin price targets, compared side by side.
See Bitcoin price odds


