
Mirex Network Liquidity: Can a $58K Pool Back a $32.1M MRX Cap?

0
0

What happens when a token's headline value runs far ahead of the cash behind its trades?
Most traders check the chart first. An earlier pool depth study flagged the same thin-pool.
Some tokens shrug off big orders. Others wobble on a handful of mid-sized swaps.
A quoted number is one thing. Execution happens against actual funds in a pool, one swap at a time.
So which group does this one belong to? The pool behind Mirex Network liquidity holds the answer.
Latest Market Data: Where the Pool-Stands Today
As of 04:00 UTC on October 24, 2026, the PancakeSwap V2 pair traded at $1.1856, per DexScreener pair data.
Metric | Reading at 04:00 UTC, October 24, 2026 |
Price | $1.1856 |
Market cap and FDV | $32.1M |
Pool-liquidity | $58K |
24-hour volume | $9.2K |
The Mirex Network PancakeSwap pair launched about one month and 22 days ago.
Why Is $MRX Liquidity Small Compared With Its Market Cap?
Market cap is price multiplied by supply. $MRX liquidity is only the cash and tokens sitting inside the pool.
That gap is wide: $32.1M against $58K of depth, a ratio near 0.18%. How much liquidity does $MRX have? Only that $58K.
But 0.18% doesn't mean only that slice of the Mirex Network market cap can be sold. Execution depends on reserves, trade direction, and other venues.
And a listing date discussion can lift valuation faster than depth.
Is Mirex Network liquidity enough to support its market cap?
Can Large MRX Trades Cause Price Slippage?
Slippage is the gap between quoted and actual fill prices. Small pools stretch it fast.
The Mirex Network liquidity-pool on PancakeSwap holds 24,703 MRX and 29,290 USDT, about $29K per side. Estimates assume a 0.25% swap fee and no other venues.
Trade size | Estimated buy impact | Estimated sell impact |
$1,000 | 3.7% | 3.5% |
$2,500 | 8.8% | 8.1% |
$5,000 | 17.3% | 14.8% |
A $5,000 sell would drag the pool price down roughly 27%. Brutal.
MRX slippage also answers whether $MRX is easy to buy and sell on PancakeSwap. Small orders pass; bigger ones get punished.
Can $MRX Trading Volume Support Its Valuation?
MRX trading volume reached $9.2K over 24 hours, about 0.03% of market cap. Roughly 16% of pool depth turned over.
A range breakout watch covered the sideways phase before this move. Thin volume alone isn't dangerous. But thin volume plus thin depth leaves no cushion.
Are Buyers or Sellers Controlling MRX Order Flow?
Sellers took control. Sell volume hit $5.3K against $3.9K of buying.
Transactions split 80 buys to 79 sells. Only 27 traders set the price. Three liquidity providers back the pool.
Could MRX Whale Wallets Pressure the Price?
DexScreener lists 1,083 holders. The top wallet holds 9.88% of supply, about 2.6M MRX, worth $3.1M.
Next in line, the second wallet holds 1.01%, or $324.2K. Just 0.09% sits in the pool contract.
That top wallet's paper value is about 53 times the entire pool. MRX whale concentration matters because of that mismatch.
But holdings aren't intentions. Nothing shows that wallet moving, and Tier 1 listing speculation can bring fast buyers. Thin pools handle fast buyers badly.
Mirex Network Price Prediction: Technical Analysis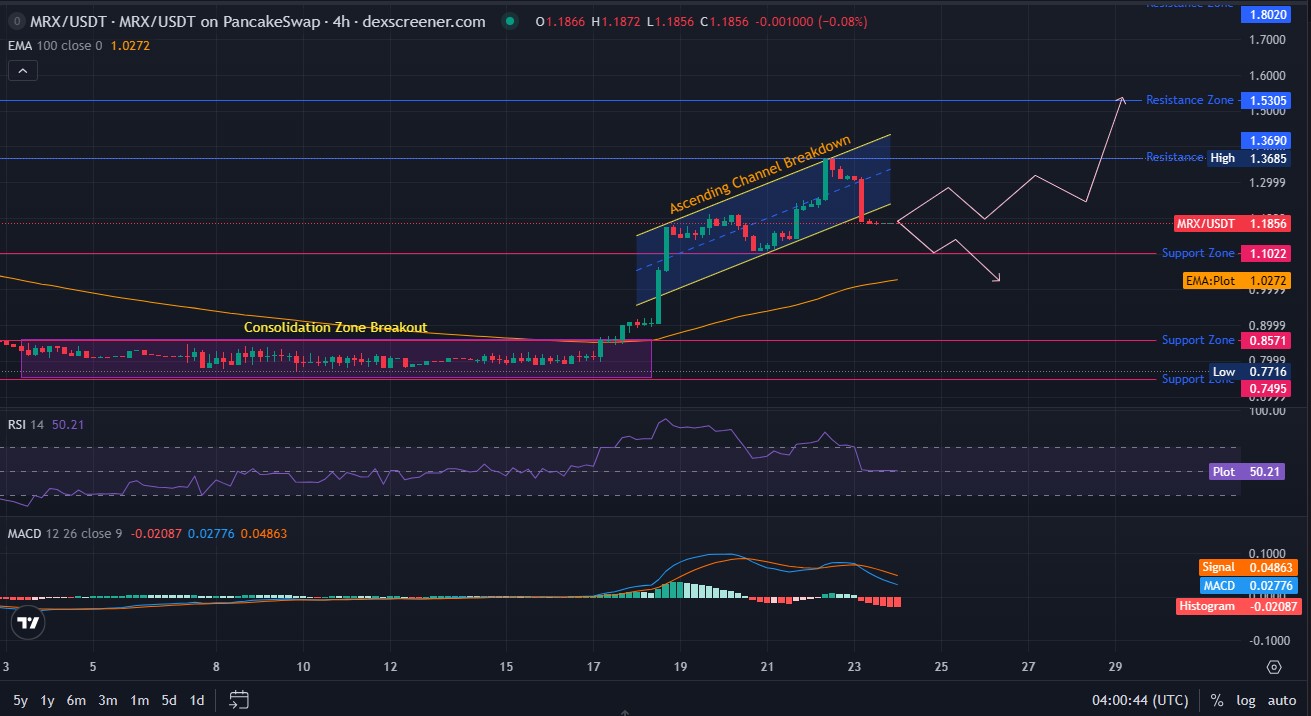
A consolidation zone held trades between $0.7716 and $0.8571 for roughly 1 weeks. Then buyers broke out.
Price climbed inside an ascending channel, up to $1.3685. An overbought RSI breakout piece covered that surge.
The breakout felt clean at first. Then again, the channel broke on the way down.
Price now sits at $1.1856, about 13% below that high and 15% above the EMA 100 at $1.0272. Short-term bias leans bearish until buyers retake the channel.
RSI and MACD: Is Momentum Cooling?
RSI reads 50.21. Neutral. It topped 70 during the rally.
MACD sits at 0.02776 under its 0.04863 signal line. The histogram reads -0.02087. Buyers are losing pace. Not a collapse, just fading.
MRX Support and Resistance Levels
Support is where buyers have stepped in before. Resistance is where sellers tend to appear.
Support starts at $1.1022, then the EMA 100 at $1.0272, with deeper zones at $0.8571 and $0.7495.
Resistance begins at $1.3690, followed by $1.5305 and $1.8020.
Mirex Network Liquidity Scenarios and Targets
A Tier 1 listing watch would test the pool first.
Scenario | Trigger | Targets | Invalidation | Liquidity condition |
Improving | Trades hold above $1.3690 on rising volume | $1.5305, then $1.8020 | Trades below $1.1022 | Pool grows past $58K |
Stagnant | Range between $1.1022 and $1.3690 | Same range | A break of either level | Pool stays near $58K |
Declining | Trades below $1.1022 | $1.0272, then $0.8571 | Reclaim of $1.3690 | Providers leave |
What Could Improve Mirex Network Liquidity?
More providers. Bigger deposits. Steadier volume.
The official Mirex website describes MRX as a utility token for gas fees and smart contract execution, with a 27M total supply, RWA tokenization, and the Lumira ecosystem. Utility is a story. Depth is a number.
Would an Exchange Listing Reduce MRX Liquidity Risk?
A centralized exchange would add order books beyond PancakeSwap. Confirmation of one isn't in the data.
An earlier Binance listing piece covered the speculation. But a rumor isn't an event, and MRX liquidity risk stays until depth changes.
Final Takeaway
Stance: cautious. Price holds above its EMA, but the channel broke, momentum faded, and the pool carries just $58K.
A credible push toward $1.5305 first needs a reclaim of $1.3690 and deeper liquidity and volume well above $9.2K. Catalyst dates can be tracked on a coin events calendar.
Disclaimer: This article is for informational purposes only and isn't financial advice. Crypto assets are volatile, and low-liquidity tokens carry added risk. Always do independent research before making any decision.
0
0
 Manage all your crypto, NFT and DeFi from one place
Securely connect the portfolio you’re using to start.