
NEON Price Prediction 2026: Can This Rally Keep Going?

0
0

Neon price prediction research usually leans on slow, steady charts. Not this week. $NEON just ripped over 227% in a single day, and the question now isn't whether it moved; it's whether it holds. Anyone comparing coins across the market can check the crypto price prediction hub for other tokens before digging into this one.
Neon EVM, the network bringing Ethereum-style contracts onto Solana, is suddenly back in traders' feeds, and the numbers behind the move matter more than the headline percentage.
Let's look at what's actually happening.
Research Snapshot
This table pulls together the core numbers behind this Neon price prediction, based on a snapshot taken near 09:00 UTC on September 23, 2026.
Item | Finding |
Current NEON price | $0.04531 |
24H change | +227.5% |
Market cap | $10.85M |
Unlocked market cap | $42.59M |
24H volume | $3.21M, up 7,285% |
Volume / market cap (24H) | 27.97% |
Fully diluted value (FDV) | $45.31M |
Circulating supply | 239.46M NEON |
Total / max supply | 1B NEON |
Holders | 16.11K |
RSI (14-period) | 94.03, deeply overbought |
Next scheduled unlock | August 7, 2027 |
Sudden volume, sudden holders, sudden price. That combination is worth sitting with for a second.
Neon Price Prediction: Current Market Snapshot
As of 09:00 UTC on September 23, 2026, NEON traded near $0.04531, per CoinMarketCap, up roughly 227.5% in 24 hours. Market cap sat near $10.85 million, small against a fully diluted value of $45.31 million.
That gap matters. Most of NEON's supply still hasn't hit the open market.
Circulating Supply, Explained
CoinMarketCap lists circulating supply at 239.46 million NEON, out of a fixed one billion total. Some third-party trackers have previously reported a higher unlocked figure near 431 million. Anyone reading long-range price targets should check which supply number a given source is using before comparing figures.
Why Is $NEON Price Moving Right Now?
Volume tells the real story here. Trading volume jumped over 7,000% in 24 hours, landing near $3.21 million. Turns out, that kind of spike rarely comes from one buyer.
Broader altcoin rotation looks like the bigger driver, not a NEON-specific announcement. And that distinction matters for how long the move can last.
Some of that rotating capital also chases early-stage plays through presale and IDO listings, which compete directly with established tokens like $NEON for the same speculative dollars.
$NEON Technical Analysis and Key Price Levels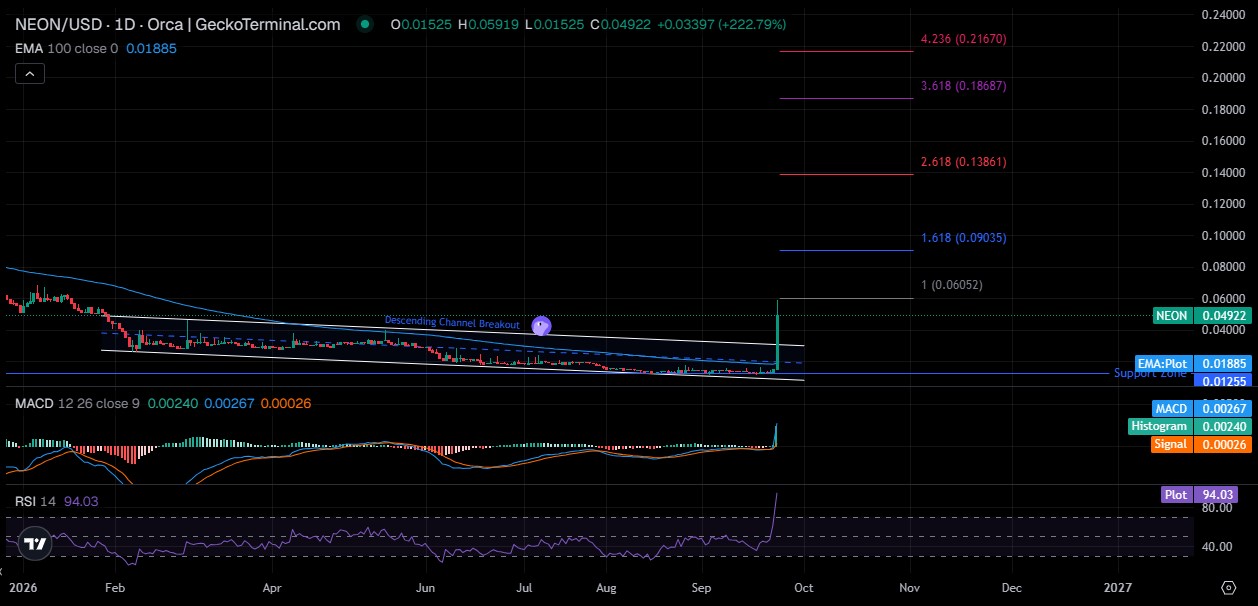
RSI and Momentum
The 14-period RSI sits at 94.03. That's extreme. Readings above 70 usually flag overbought conditions, and 94 is deep into euphoria territory.
Trend Structure
Price sat inside a falling channel for months before this move, printing lower highs and lower lows. Then it broke out, hard, erasing months of bearish structure in one session.
The breakout candle opened trading near $0.01525, stretched to a high of $0.05919, and was still trading near $0.04922 by the time the session wrapped, a single-day move of roughly 222.79%. The 100-day EMA, plotted at $0.01885, lines up closely with the support zone below, reinforcing why that range matters as more than a round number.
MACD and Trend Confirmation
The MACD line reads 0.00267 against a signal line of 0.00026, with the histogram at 0.00240 and expanding. A widening, positive histogram alongside a breakout candle confirms momentum; it doesn't contradict it. Live charting on GeckoTerminal shows the same descending-channel breakout pattern directly on the daily NEON/USD pool chart.
Breakout Confirmation
A trading close above $0.0605, on volume holding near current highs, would confirm the breakout and open a path toward $0.0903.
Breakdown Risk
Losing the $0.0125 zone would undo the entire bullish structure and send the price back toward the prior range.
NEON Support and Resistance Zones
Support now sits between $0.0125 and $0.0189, the former ceiling of the months-long falling channel, now acting as a floor.
Resistance stacks up near $0.0605 first, then $0.0903, based on Fibonacci extension levels drawn from the breakout.
Old resistance becoming new support is one of the more reliable patterns a chart can show.
NEON Volume and Liquidity Analysis
A 7,285% volume spike alongside a 227% price move is the healthiest combination a breakout can show. A rising price with rising volume suggests real participation, not a thin wick that reverses on the next candle.
But one violent session doesn't prove the move sticks. Volume needs to stay elevated, not just spike once.
Checking crypto exchange listings shows where that volume is actually concentrated, which matters more than the headline number alone.
Neon EVM Network Activity and the Adoption Question
A price surge doesn't automatically mean network usage caught up. A holder count near 16.11K shows fresh interest, but actual on-chain activity, deployed applications, and transaction volume are the slower-moving numbers that decide whether this rally has real legs.
Watching whether that activity follows the price or lags behind it is the next thing worth tracking.
$NEON Tokenomics and Supply Outlook
Total and max supply both sit at one billion NEON. A circulating supply near 239.46 million puts the circulation ratio close to 24%, leaving roughly 761 million tokens still outside the open market.
The next scheduled unlock lands August 7, 2027. Future unlocks remain the clearest long-term supply risk, since they can add sellers without automatically adding buyers.
Tracking dates like this through a coin events calendar helps traders avoid surprise supply shocks.
NEON Price Prediction 2026
Scenario | Price Range | Required Conditions | Invalidation |
Bear | $0.018 – $0.028 | Weak demand, support failure | Reclaim of $0.019 |
Base | $0.035 – $0.060 | Consolidation, stable volume | Breakdown below $0.018 |
Bull | $0.075 – $0.140 | Breakout confirmed, volume holds, altcoin market strong | Failed breakout at resistance |
NEON Price Prediction 2027 and Long-Term Outlook Through 2030
Year | Bear | Base | Bull | Main Driver |
2027 | $0.02 | $0.06 | $0.18 | Adoption plus market cycle |
2028 | $0.03 | $0.09 | $0.30 | Ecosystem growth |
2029 | $0.03 | $0.12 | $0.45 | Liquidity and demand |
2030 | $0.04 | $0.18 | $0.70 | Network usage, market conditions |
Bull-case 2030 implies a market cap near $700 million against current circulating supply. That's a big ask. It's not impossible, but it needs sustained adoption, not one viral candle.
These ranges assume circulating supply stays close to the current 239.46 million. If a meaningful share of the remaining 761 million locked tokens enters the market before 2029 or 2030, the same price levels would sit on a larger market cap than the figures above suggest.
Broader speculative cycles, including sudden memecoin market news swings, can also pull altcoin valuations further than tokenomics alone would justify, in either direction.
Bull, Base, and Bear $NEON Scenarios
Using the reported 239.46 million circulating supply, price, and market cap scale together in a fairly direct way.
NEON Price | Approx. Market Cap |
$0.01 | $2.39M |
$0.05 | $11.97M |
$0.10 | $23.95M |
$0.20 | $47.89M |
$1.00 | $239.46M |
A dollar $NEON, under this supply figure, implies a market cap near $239 million, more than twenty times the current level. Reaching it would take far more than one week of momentum.
What Could Invalidate the NEON Outlook?
Bullish invalidation: a trading close below $0.0125 on strong sell volume, unwinding the breakout structure entirely.
Bearish invalidation: a confirmed close above $0.0605 with volume holding near recent highs, opening the door toward $0.0903 and beyond.
A wave of selling tied to crypto airdrop claims could also add pressure on support if early recipients cash out fast.
Watch which one shows up first.
A Lesson From Old NEON Forecasts
Early 2024 predictions placed NEON near $4.94 to $6.23 by 2025. Actual 2025 performance landed nowhere close, closing the year far below those numbers before the recent bounce.
That gap is the risk of long-range numerical forecasts built without checking supply, liquidity, and adoption first.
What Traders Should Watch Next
Whether volume stays elevated or fades back toward pre-breakout levels
RSI cooling off from overbought
A confirmed close above $0.0605
Support retention near $0.0125
Holder count trend
Circulating supply unlocks, including the August 2027 date
Broader altcoin market liquidity
Wider AI-related crypto news that could shift risk appetite across altcoins
Disclaimer
This article is for informational purposes only and does not constitute financial, investment, or trading advice. Cryptocurrency markets are highly volatile, and prices can move sharply in either direction. Data referenced here reflects a snapshot near 09:00 UTC on September 23, 2026, and may have changed since publication. Anyone considering a trade should verify current data through primary sources and conduct independent, thorough research before making any financial decision.
0
0
 Manage all your crypto, NFT and DeFi from one place
Securely connect the portfolio you’re using to start.