
Gold Price Prediction: Why Are Pension Funds Dumping Bonds for Gold?

0
0

Gold has pushed back above $4,200 this week, lining up with claims of fresh institutional buying. One widely shared post from the account Bull Theory claimed over $500 billion flowed into gold and silver in a four-hour window.
Separately, economist Steve Hanke posted that pension funds are shifting from bonds into gold, citing a Goldman Sachs note on reducing portfolio volatility.
This Gold price prediction covers what the chart shows and the key levels now in play.
Quick take: Gold is trading at $4,183.62 after breaking a multi-week downtrend on the 4H chart. Holding above $4,100 keeps the setup constructive, with $4,400 and $4,701.23 as the next levels to watch; a close back below $4,100 would put the breakout in doubt.
Gold Price Today: Market Snapshot
Metric | Value |
Price | $4,183.62 |
24-hour Change | +1% |
Source: Gold Spot / U.S. Dollar 4H chart via TradingView (Pepperstone), captured October 9, 2026.
What's Driving Gold Right Now
Bull Theory posted that over $500 billion was added to gold and silver in four hours, with gold reclaiming $4,200 and silver topping $60.
Steve Hanke separately posted that pension funds are rotating from bonds into gold, citing a Goldman Sachs note on lowering portfolio volatility.
Source: Data From X
Both are social media claims, not independently verified data, so they're treated here as sentiment context rather than confirmed fact.
Gold Price Chart: Technical Analysis
Gold price today is trading at $4,183.62, up 1%. Price fell from a late-August high near $4,660 into a steady downtrend through September, tracing a descending trendline the whole way down.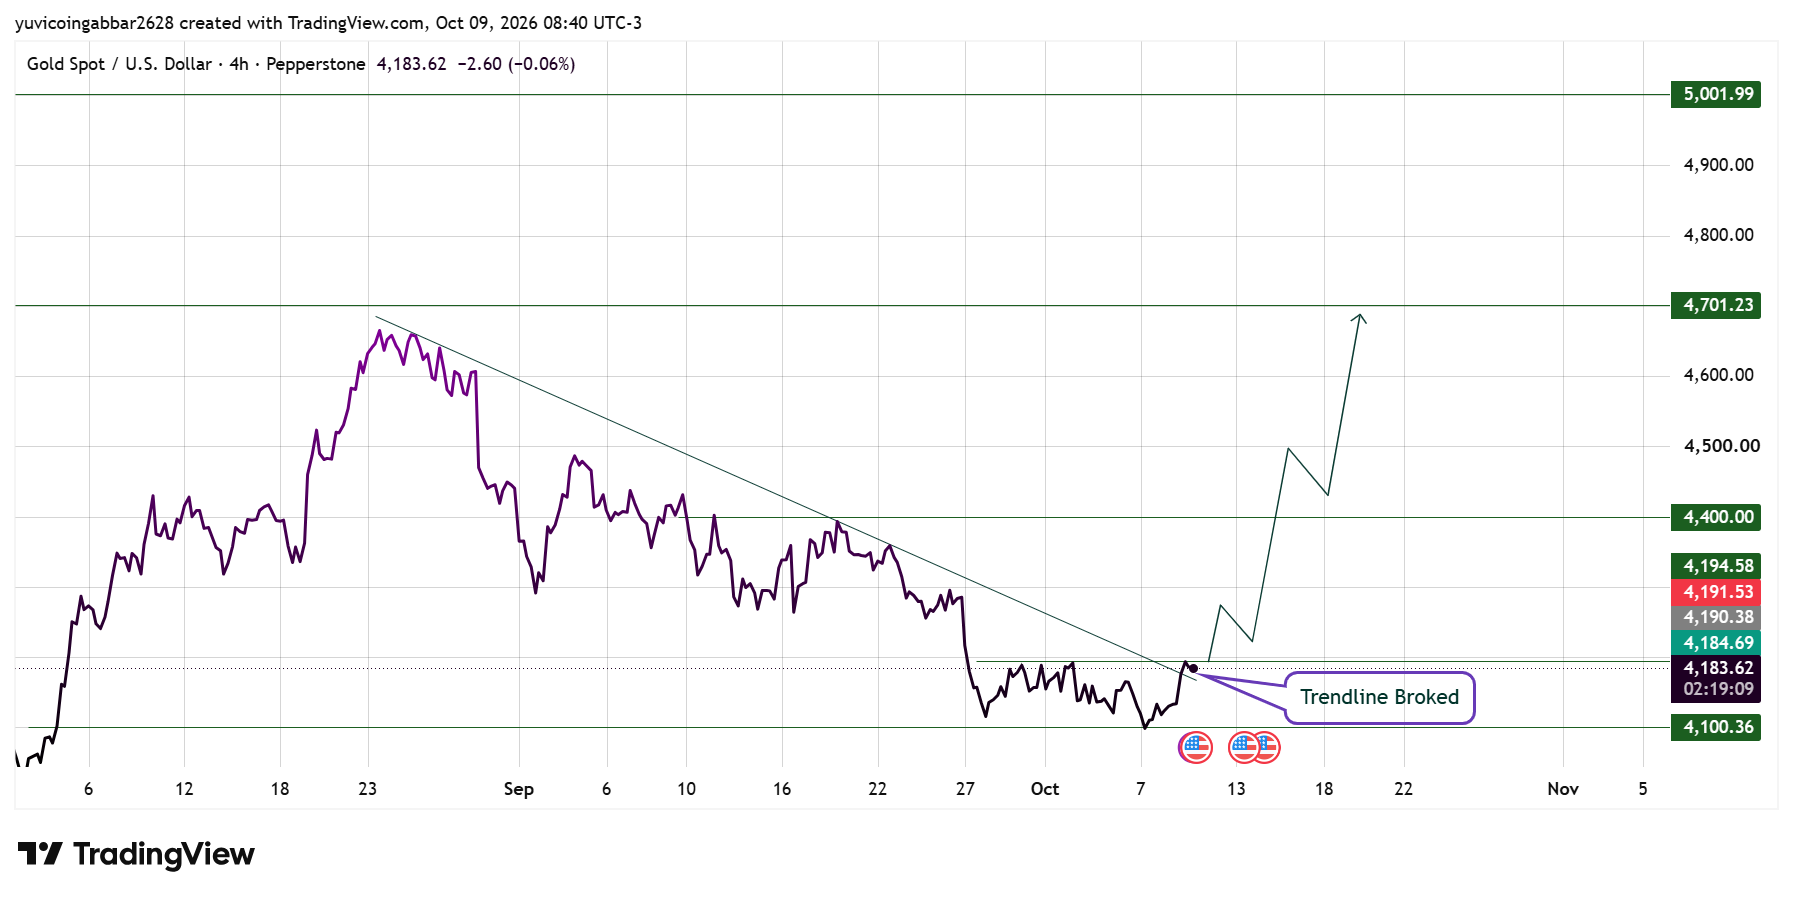
In the first week of October, the price broke back above that trendline, the first confirmed break since the pattern formed.
A trendline break means the price has closed above a line that capped every prior rally, which traders read as an early sign selling pressure is easing.
Support and Resistance Levels
Level Type | Price |
Resistance 2 | $5,001.99 |
Resistance 1 | $4,701.23 |
Near-Term Resistance | $4,400.00 |
Immediate Price Reference | $4,183.62 |
Support (trendline zone) | $4,100.36 |
Support and resistance are price zones where buying or selling has repeatedly shown up in the past; they're read as areas likely to matter again, not guaranteed turning points.
Gold Forecast: Bull Case vs Bear Case
Bull case: Holding above the $4,100 trendline zone on a daily close basis keeps the breakout valid. A confirmed move above $4,400 would open the path toward $4,701.23.
Bear case: A daily close back below $4,100 would put the trendline break in question and suggest the recent bounce was a short-term move rather than a trend change.
Gold Price Prediction: Can Gold Reach $4,701.23?
$4,701.23 is the nearest major resistance above the current trendline zone, sitting close to gold's late-August high.
Reaching it would require a confirmed close above $4,400 first, and that level has not yet been tested since the breakout, so this stays a level to watch rather than a confirmed target.
Gold Price Prediction 2026: Expert View
According to CoinGabbar analysts, the trendline break is the clearest signal here, marking the first structural shift after weeks of lower highs.
The institutional buying claims add to the bullish mood but aren't confirmed drivers on their own.
The $4,100 zone now decides whether this turns into a sustained move or fades back into range.
Disclaimer
This is a read of the chart and publicly available commentary as they stand today, not financial advice. The social media claims referenced above have not been independently verified. Gold prices can move quickly on macro news, so treat these levels as things to watch rather than guarantees, and do your own research before making any financial decision.
0
0
 Manage all your crypto, NFT and DeFi from one place
Securely connect the portfolio you’re using to start.