
Why Is Crypto Down Today? Bitcoin, Ethereum, and XRP Prices Fall Again

0
0

Why is crypto down today? A sudden Bitcoin drop set off a chain reaction across the market.
Bitcoin fell about $2,000 within 30 minutes after touching a high above $85,600. More than $550 million in leveraged bets were wiped out in 24 hours.
Ethereum slid 2.80% to trade near $2,600. XRP, DOGE, and ADA lost up to 2%-4%.
Why Is Crypto Down Today?
The main cause looks like a leverage flush. Most of the losses came from long positions, which are bets that prices will rise.
When the price dipped fast, exchanges closed many of these trades by force. That pushed prices down even more.
Large transfers also added to the worry. Bitcoin and BNB moved from U.S. government-linked wallets to exchanges around the same time. No sale has been confirmed.
Why Is Bitcoin Dropping Today?
BTC price slid from above $85,600 to near $84,000. Long liquidations and wallet transfers added to the pressure.
Why Is Ethereum Down Today?
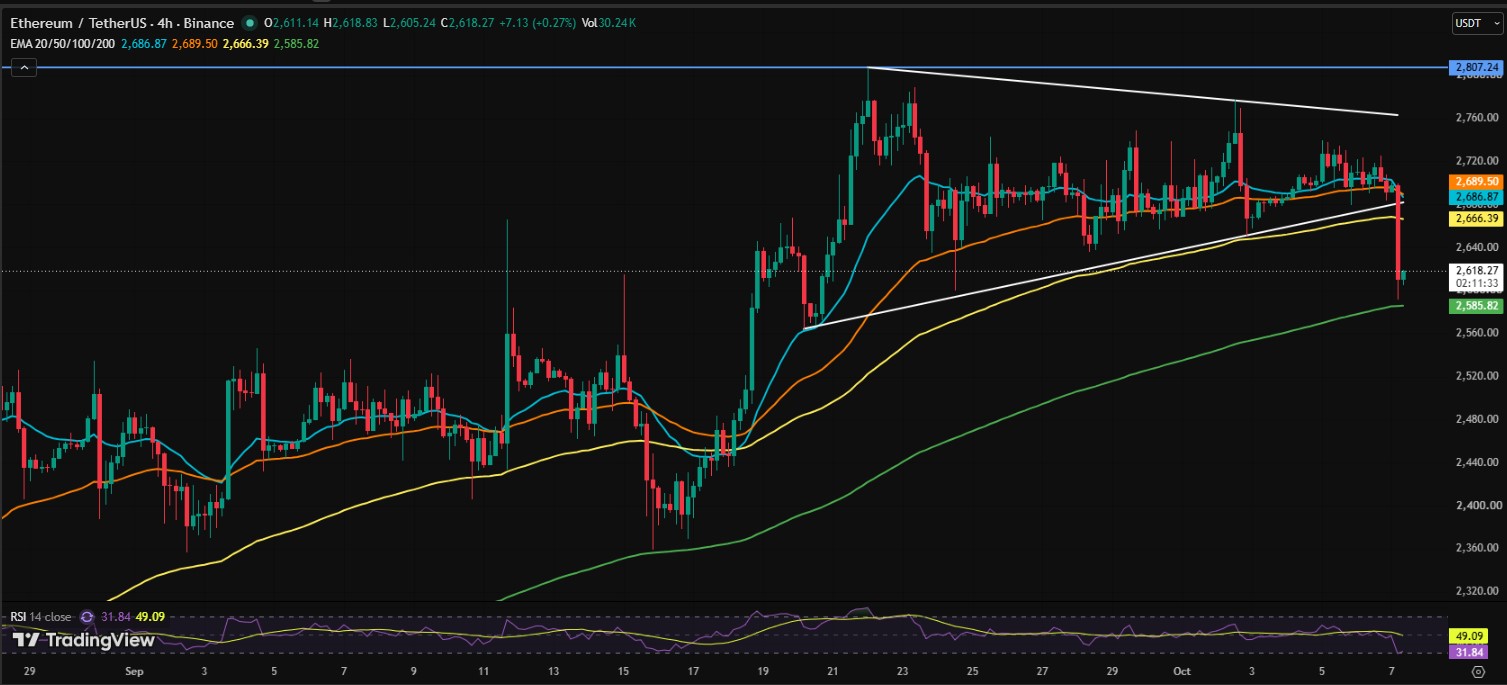
Ether fell 4% below $2,600 after breaking down from a triangle pattern. ETH ETFs also saw $201.89 million in outflows.
How Many Traders Were Liquidated in the Last 24 Hours?
CoinGlass data shows 104,247 traders were liquidated. The largest single hit was a $26.64 million ETH-USDC position on Binance.
Liquidation Data (24 Hours) | Amount |
Total liquidations | $552.78 million |
Long positions | $484.85 million |
Short positions | $67.93 million |
Ethereum | $176.29 million |
Bitcoin | $144.99 million |
Longs made up about 88% of the total. That tells you which side got hurt the most.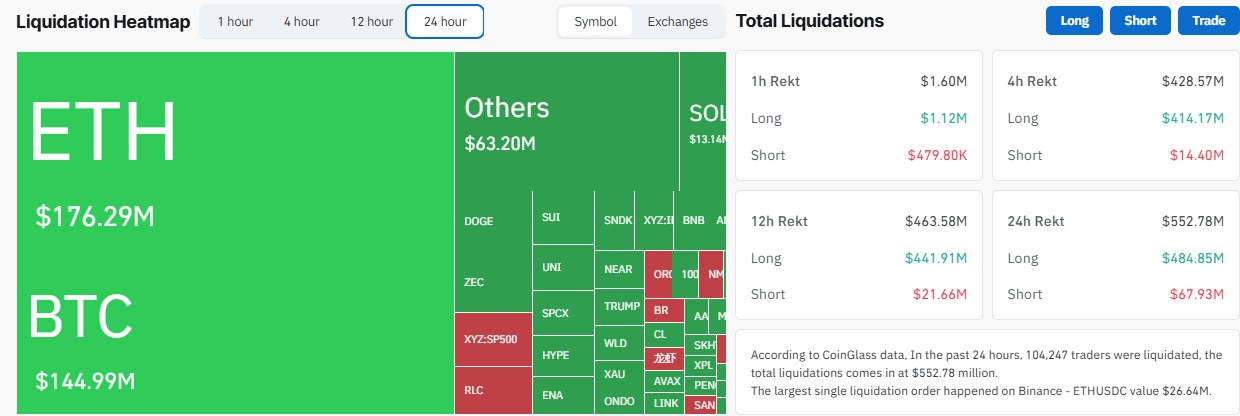
Did Someone Short Bitcoin Before the Crash?
Four new Hyperliquid wallets deposited a combined $1 million in USDC just before the drop. They then opened 40x short positions on 148.49 BTC.
That is roughly $12.5 million in notional exposure. BTC price slipped near $84,000 soon after.
The timing looks unusual in hindsight. Still, nothing here proves who was behind the wallets.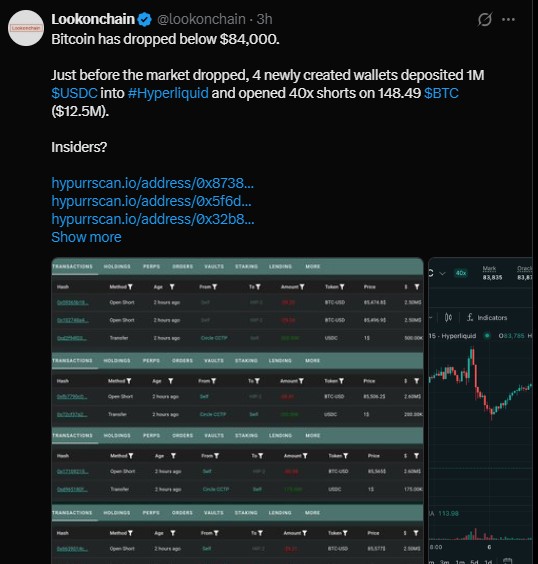
Will the Fed Raise or Cut Rates in October 2026?
Traders expect the Federal Reserve to hold rates at 3.75% to 4.00%. The odds of no change sit at 79%.
Fed Outcome (Oct 28) | Probability | One Week Ago |
Hold at 3.75%-4.00% | 79.0% | 62.4% |
Hike to 4.00%-4.25% | 21.0% | 37.6% |
Cut to 3.50%-3.75% | 0% | n/a |
Expectations moved a bit more hawkish over the week. Higher rates often add pressure to risk assets like crypto.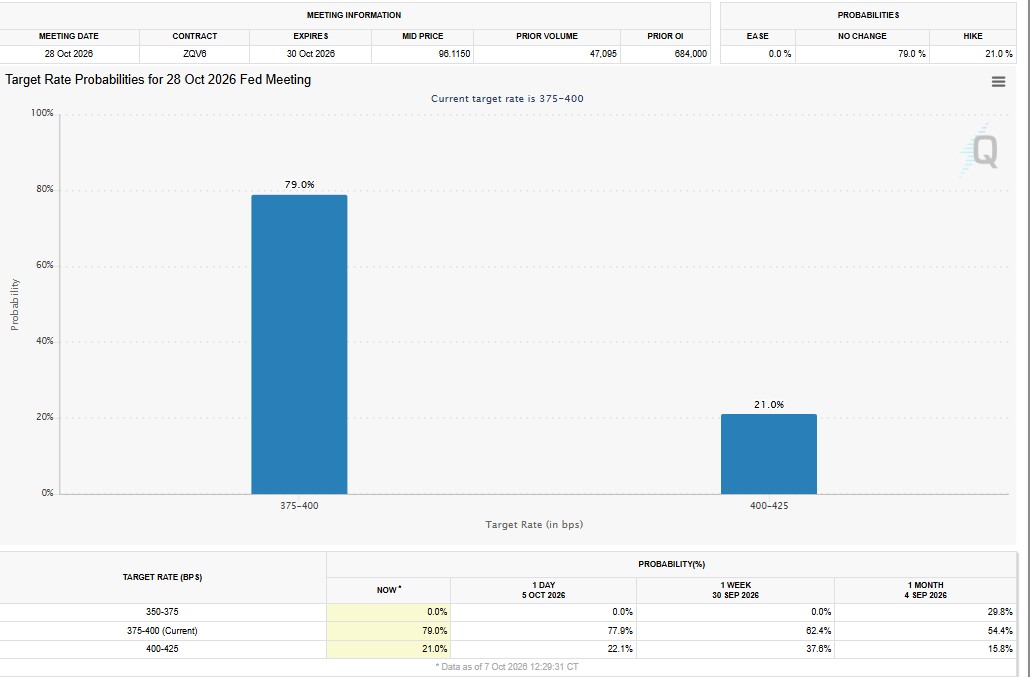
Is the Crypto Market Still Bullish?
Mixed, but not panicked. The Fear & Greed Index reads 71, which means Greed. It was 73 yesterday and 71 last week and last month.
Bitcoin also saw its biggest net exchange outflow in seven months. On Monday, 24,073 BTC left exchanges, the most in a single day since March 1st.
Exchange supply is now about 6.50% of total BTC supply. Fewer coins on exchanges can mean less selling pressure. It guarantees nothing, though.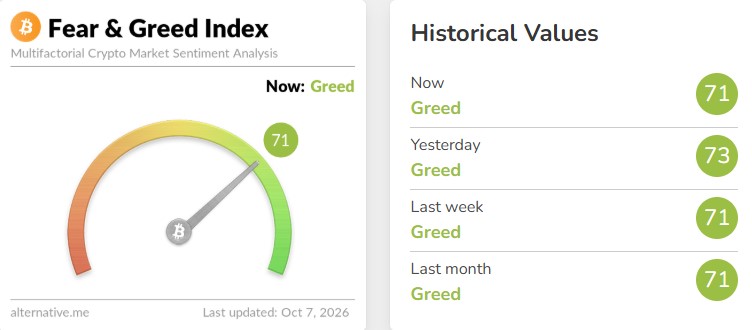
Are Bitcoin ETFs Seeing Inflows or Outflows Today?
ETF flows were split as of October 6.
ETF | Daily Flow | 30-Day Flow |
Bitcoin (BTC) | +$118.86 million | +$2.20 billion |
Ethereum (ETH) | -$201.89 million | +$356.32 million |
Solana (SOL) | -$3.68 million | +$248.82 million |
XRP | +$3.14 million | +$112.01 million |
Bitcoin drew money in. Ethereum saw money leave.
What Is the Bitcoin Price Prediction Today?
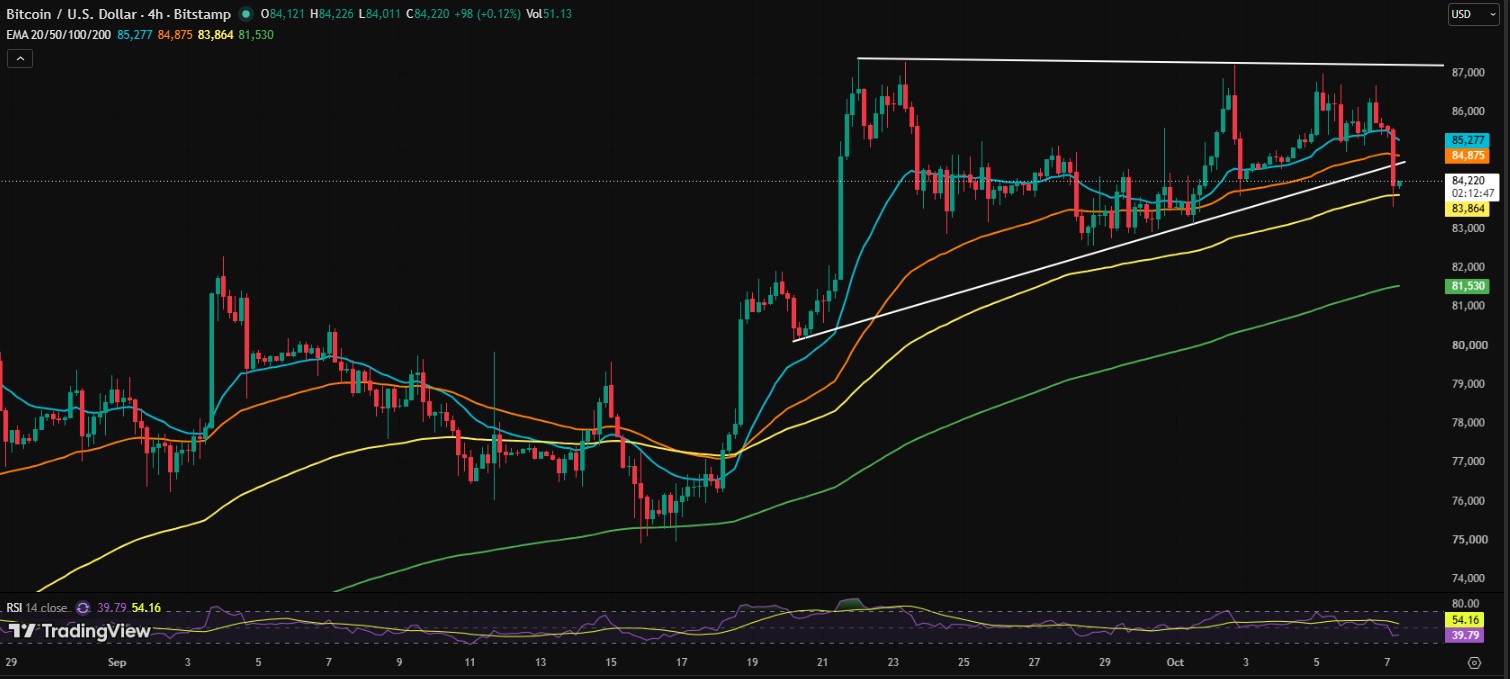
BTC trades near $84,220 on the 4-hour chart. That is below the 20-EMA at about $85,277. RSI is near 40, so short-term momentum looks weak.
The bigger picture still leans bullish after the breakout from the $76,000 to $78,000 area.
Support: $84,000 to $83,800. A break below could lead to $82,000 to $81,500.
Resistance: $85,500 to $86,500, then the major $87,000 level.
Upside case: A clean break above $87,000 could open $88,000 to $90,000.
What Is the Ethereum Price Prediction Today?
ETH broke down from a symmetrical triangle on the 4-hour chart. It trades near $2,620, with RSI around 32.
A low RSI can hint at a short-term bounce. But the pattern still favors sellers for now.
First support: $2,600, then $2,550.
Measured move target: $2,450 to $2,475.
Bulls need: A move back above $2,675 to $2,700, which could lead to $2,750 to $2,800.
What Is the XRP Price Prediction Today?
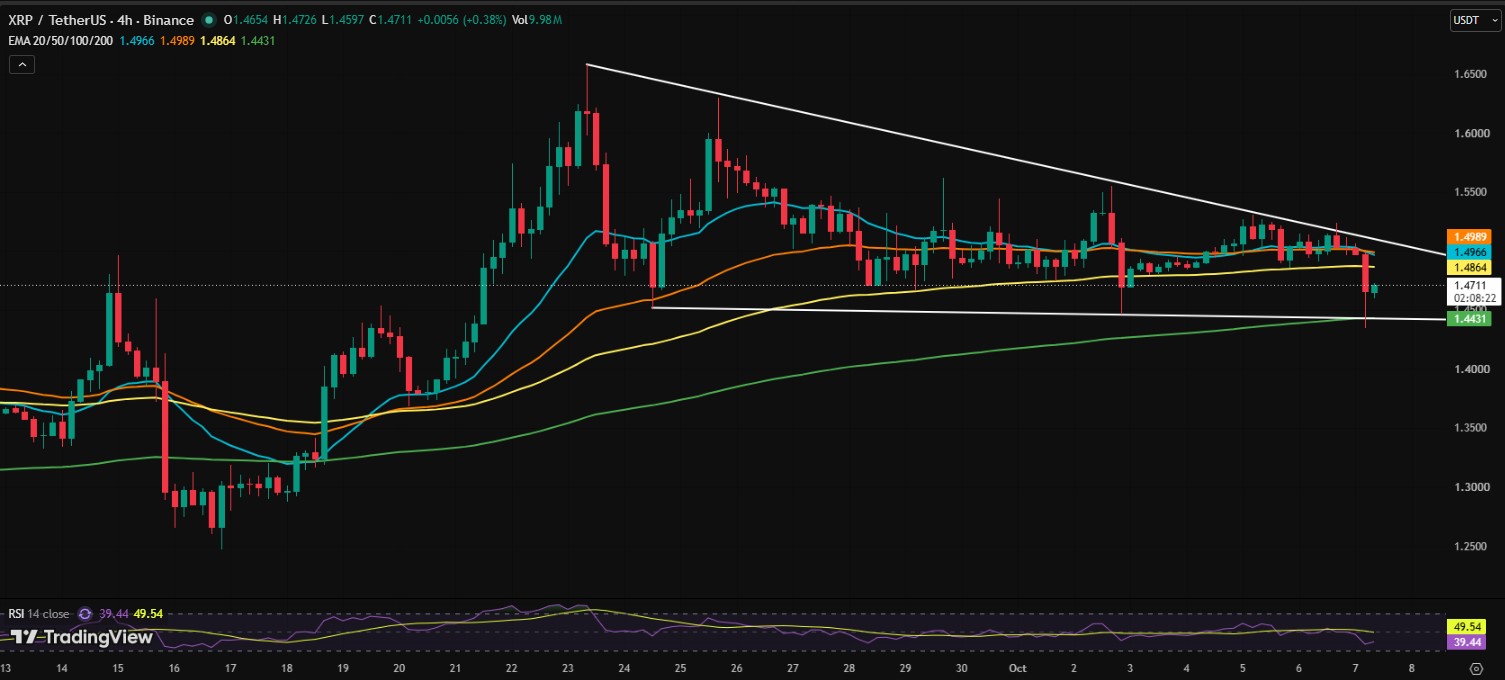
XRP forms a descending triangle on the 4-hour chart. It trades below the 20, 50, and 100 EMA, with RSI near 39.
Support: $1.44 to $1.46. A close below $1.44 could point to $1.40 to $1.42, then $1.35.
Resistance: $1.50. A break above $1.49 to $1.50 weakens the bearish case.
Upside case: A move above the trendline could lead to $1.55 to $1.60.
What Are the Key Bitcoin, Ethereum, and XRP Price Levels?
Coin | Price Near | Key Support | Key Resistance |
Bitcoin | $84,220 | 83,800-84,000 | $87,000 |
Ethereum | $2,620 | $2,600-$2,550 | 2,675-2,700 |
XRP | Below $1.50 | 1.44-1.46 | $1.50 |
Will Bitcoin Go Up or Down Next?
So, why is crypto down today? Mostly leverage, a fast dip, and some nervous headlines.
Watch the $84,000 zone for Bitcoin and $2,600 for Ether. Keep an eye on ETF flows and the October 28 Fed meeting too.
Markets can turn quickly in either direction. No one knows what comes next.
Disclaimer
This article is for information only. It is not financial, investment, or trading advice. Crypto is volatile and carries a high risk of loss, especially with leverage. Price levels and predictions are based on chart patterns and can be wrong. Do your own research and speak with a licensed financial adviser before making any decision.
0
0


 Manage all your crypto, NFT and DeFi from one place
Securely connect the portfolio you’re using to start.


