
Pons Price Prediction: Can Robinhood Wallet Push PONS $0.31?

0
0

Can a 17% jump in a day hold after a month-long slide?
Pons answered on October 28, 2026, breaking out of a falling wedge on the 4-hour chart while volume jumped 173.2%.
This Pons price prediction leans bullish above $0.2673, with a retest likely first. Longer-range targets sit in the Pons 2026 coin forecast.
Every PONS price analysis level below comes from the 4-hour OKX chart and live exchange data.
PONS Data Snapshot on October 28, 2026 at 10:00 UTC
Metric | Value |
Price | $0.2897 |
24h change | +17.34% |
24h range | $0.2446 to $0.3106 |
Market cap | $194.72M |
24h volume | $66.7M |
Circulating supply | 671.94M PONS |
Rank | 137 |
Volume equals 34.05% of market cap, which is busy for a $194.72M token. Figures come from CoinMarketCap, where PONS ranks 137.
Robinhood Wallet Listing Sparked the Move
Breaking. Pons now shows up inside Robinhood Wallet, and traders reacted fast.
Launch and trade tools sit under the Robinhood Chain tab. Buyers took the hint. Wallet visibility puts launchpad tokens in front of a huge retail audience.
The Pons announcement on X pulled 44K views and 645 likes in 16 hours, while Binance futures printed $65.63M.
Technical Analysis: Falling Wedge Breakout on the 4-Hour Chart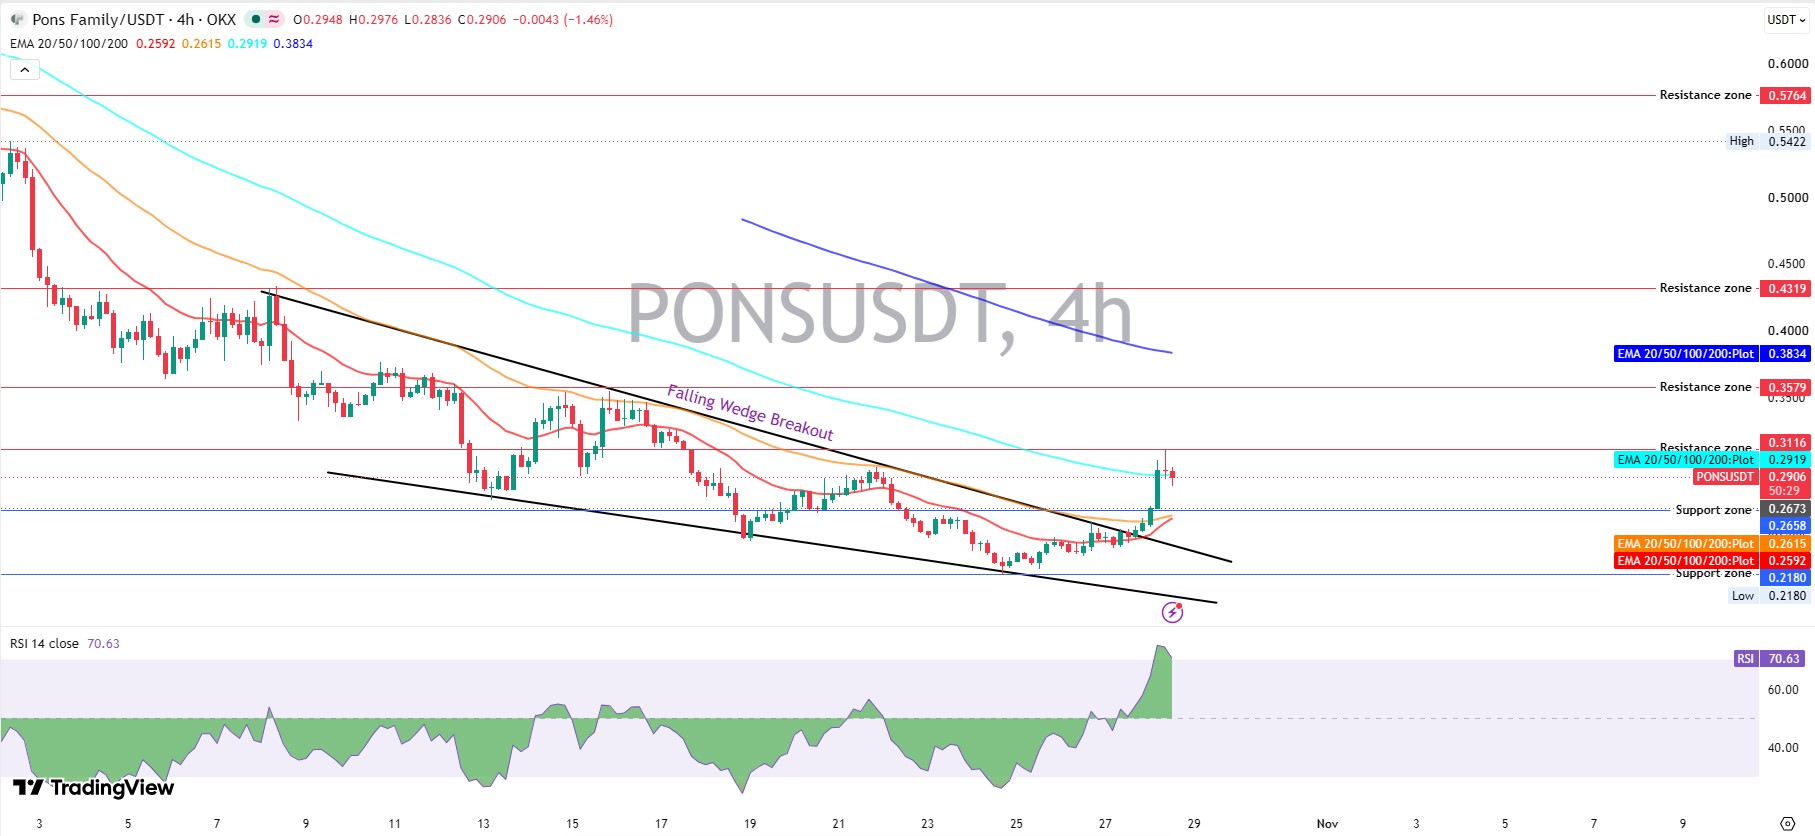
A falling wedge is a narrowing downtrend that often ends with a pop higher. Sellers kept PONS inside one from the $0.4319 area on October 8, 2026, until buyers cleared the upper line near $0.2615 on October 27, 2026.
Then came the PONS falling wedge breakout. Price spiked to $0.3106 before the latest 4-hour candle settled at $0.2906, down 1.46%.
But the spike stalled just under $0.3116, a level sellers defended on the TradingView chart.
EMA and RSI Show Buyers Are Stretched
The 20 EMA sits at $0.2592, and the 50 EMA at $0.2615, both under price. And the 100 EMA at $0.2919 is the line PONS is hugging right now.
The 200 EMA at $0.3834 hangs far overhead. Reclaiming it is a different story.
RSI is the part that bothers. Specifically 70.63 on the 4-hour, just inside overbought.
Exchange-news reactions are covered in the Bybit listing rally analysis.
Derivatives Data on Open Interest and Long Short Ratio
Futures volume reached $210.82M against $35.84M in spot, per Coinglass. Open interest totals $117.66M, and Binance's slice of $25.87M grew 17.18% in a day.
The long short ratio (long bets divided by short bets) reads 1.9326 on Binance accounts and 1.34 on OKX. Binance leads futures volume at $65.63M, OKX follows at $51.45M, and LBank adds $32.37M. Top Binance traders lean even harder long at 2.3069 by positions.
Liquidations and Futures Flows
Short liquidations reached $219.97K against $58.61K for longs over 24 hours. But the latest 4-hour window flipped, with longs losing $26.26K and shorts only $5.43K.
Futures net flow turned negative too, at -$241.08K over 30 minutes. So who's left to buy at $0.31?
And a spot volume of $35.84M says retail isn't convinced yet.
Holder Growth on Robinhood Chain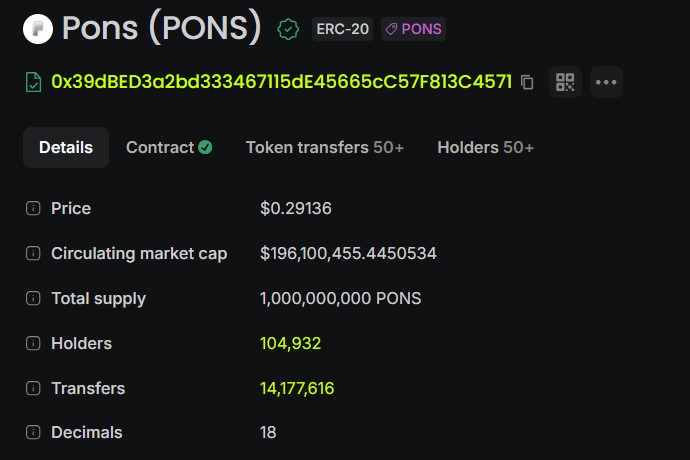
The Robinhood Chain explorer lists 104,932 holders and 14,177,616 transfers, with the token at $0.29136.
CoinMarketCap counts 102.69K holders, so both sources agree the base tops 100K. That's a wide base for a token ranked 137.
PONS Price Prediction Target Scenarios
A retest of $0.2673 feels like the easy call. Scratch that, because $66.7M in volume says buyers won't wait politely.
Every branch of this Pons price prediction starts at $0.2673. The first PONS price target sits at $0.3116, followed by $0.3579.
Scenario | Trigger | Target | Invalidation | Liquidity Condition |
Bull continuation | 4-hour trade above $0.3116 | $0.3579, then $0.4319 | Back under $0.2673 | Futures volume above $210M, short liquidations rising |
Retest and bounce | Dip to $0.2673 that holds | $0.3116 | Trades under $0.2658 | Spot volume above $35M |
Breakdown | Loses the 50 EMA at $0.2615 | $0.2180 | Reclaims $0.2919 | Net futures outflows widen |
PONS Support and Resistance Levels
PONS support and resistance stack up as $0.2673, $0.2658 and $0.2180 below, with $0.3116, $0.3579, $0.4319 and $0.5764 above. The Fed meeting setup shows how PONS reacted on macro days.
Can PONS Reach $1?
That needs a 245% jump from $0.2897, with $0.5764 as the first wall.
Not in this move. The all-time high of $0.9683 printed on September 5, 2026, and the price still sits 69.89% under it.
Other altcoin setups are tracked in the crypto price predictions hub.
Risks Traders Shouldn't Ignore
PONS fell 49.60% over 30 days, so this bounce sits inside a bigger downtrend. And RSI at 70.63 after a 17% day invites profit taking.
Liquidity is thin at 8.60% of market cap, so one big sell order moves price faster than on larger coins. Launchpad tokens swing with sentiment, and memecoin market news can move them fast.
Any Pons price prediction has to respect that. The PONS price forecast stays bullish above $0.2673. A trade above $0.3116 on volume flips it fully, while a trade under $0.2658 hands control back to sellers.
Disclaimer: This article is for information only and isn't financial advice. Crypto prices move fast, and the levels above can fail within hours. Do your own research and only risk money you can afford to lose.
0
0

 Manage all your crypto, NFT and DeFi from one place
Securely connect the portfolio you’re using to start.