
Is JUST a Good Buy at Current Prices?

0
0

JUST (JST) trades at $0.1392, just 2.4 percent below the twelve-month high of $0.1426 the token set on 10 October 2026. Measured from its low of $0.0341 on 29 October 2025, JST has gained 308 percent, and it still sits above both of the moving averages that matter for this kind of asset. That combination poses the question this article answers: is JUST a good buy at current prices, or has the easy part of the move already been paid for?
The figures below are our own calculation. We derived the moving averages, the relative strength index and the twelve-month range from the daily closing prices that CoinMarketCap publishes for JST, and they describe the market as it stood on 28 October 2026.
JUST price analysis: where the JST price stands and which levels matter
At $0.1392 JUST carries a market capitalisation of $1.12 billion, which puts the token at rank 59 among all crypto assets. Three levels frame the chart. Above the price sits the twelve-month high at $0.1426, a ceiling the market has tested twice this month without closing above it. Below it runs the 50-day moving average at $0.1289, held as support since mid-September. Further down, the 200-day moving average at $0.1008 marks the floor of the whole advance, 38.1 percent below the current price.
The gap of 27.9 percent between those two averages is the most informative number on the chart. It is wide, and it is the signature of a trend that has run hard rather than one that has just begun. The direction of travel is unambiguous, and there is no cheap entry left: anyone buying JST today pays roughly four times the price of a year ago.
The narrow band between $0.1289 and $0.1426 is where the decision actually gets made. As long as JST closes inside it, the market is neither confirming the breakout nor rejecting it. A daily close above $0.1426 would turn the ceiling into a floor and open the chart upward with no reference point from the past twelve months. A close below $0.1289, by contrast, would put the 200-day average at $0.1008 back in play as the next meaningful level, and that is a drop of 27.6 percent from where the price trades now.
The JUST trend: broken or only interrupted?
Over the past seven days JST has lost 0.9 percent, which is less a correction than a pause. The thirty-day change is still positive at 8.7 percent, the ninety-day change at 41.1 percent, and over twelve months the token is up 305 percent. A trend that gives back under one percent in a week while the quarterly gain stays above forty percent is interrupted, not broken.
What makes the pause worth watching is where it happens. JST stalled directly beneath its high, not after a sharp rejection from it. Consolidation at the top of a range is usually the market absorbing supply from holders who bought much lower and are taking profit. If that supply is cleared, the breakout follows; if it is not, the price slides back into the range and the attempt is postponed. The chart alone cannot tell you which, and anyone who claims otherwise is reading a coin flip as a forecast.
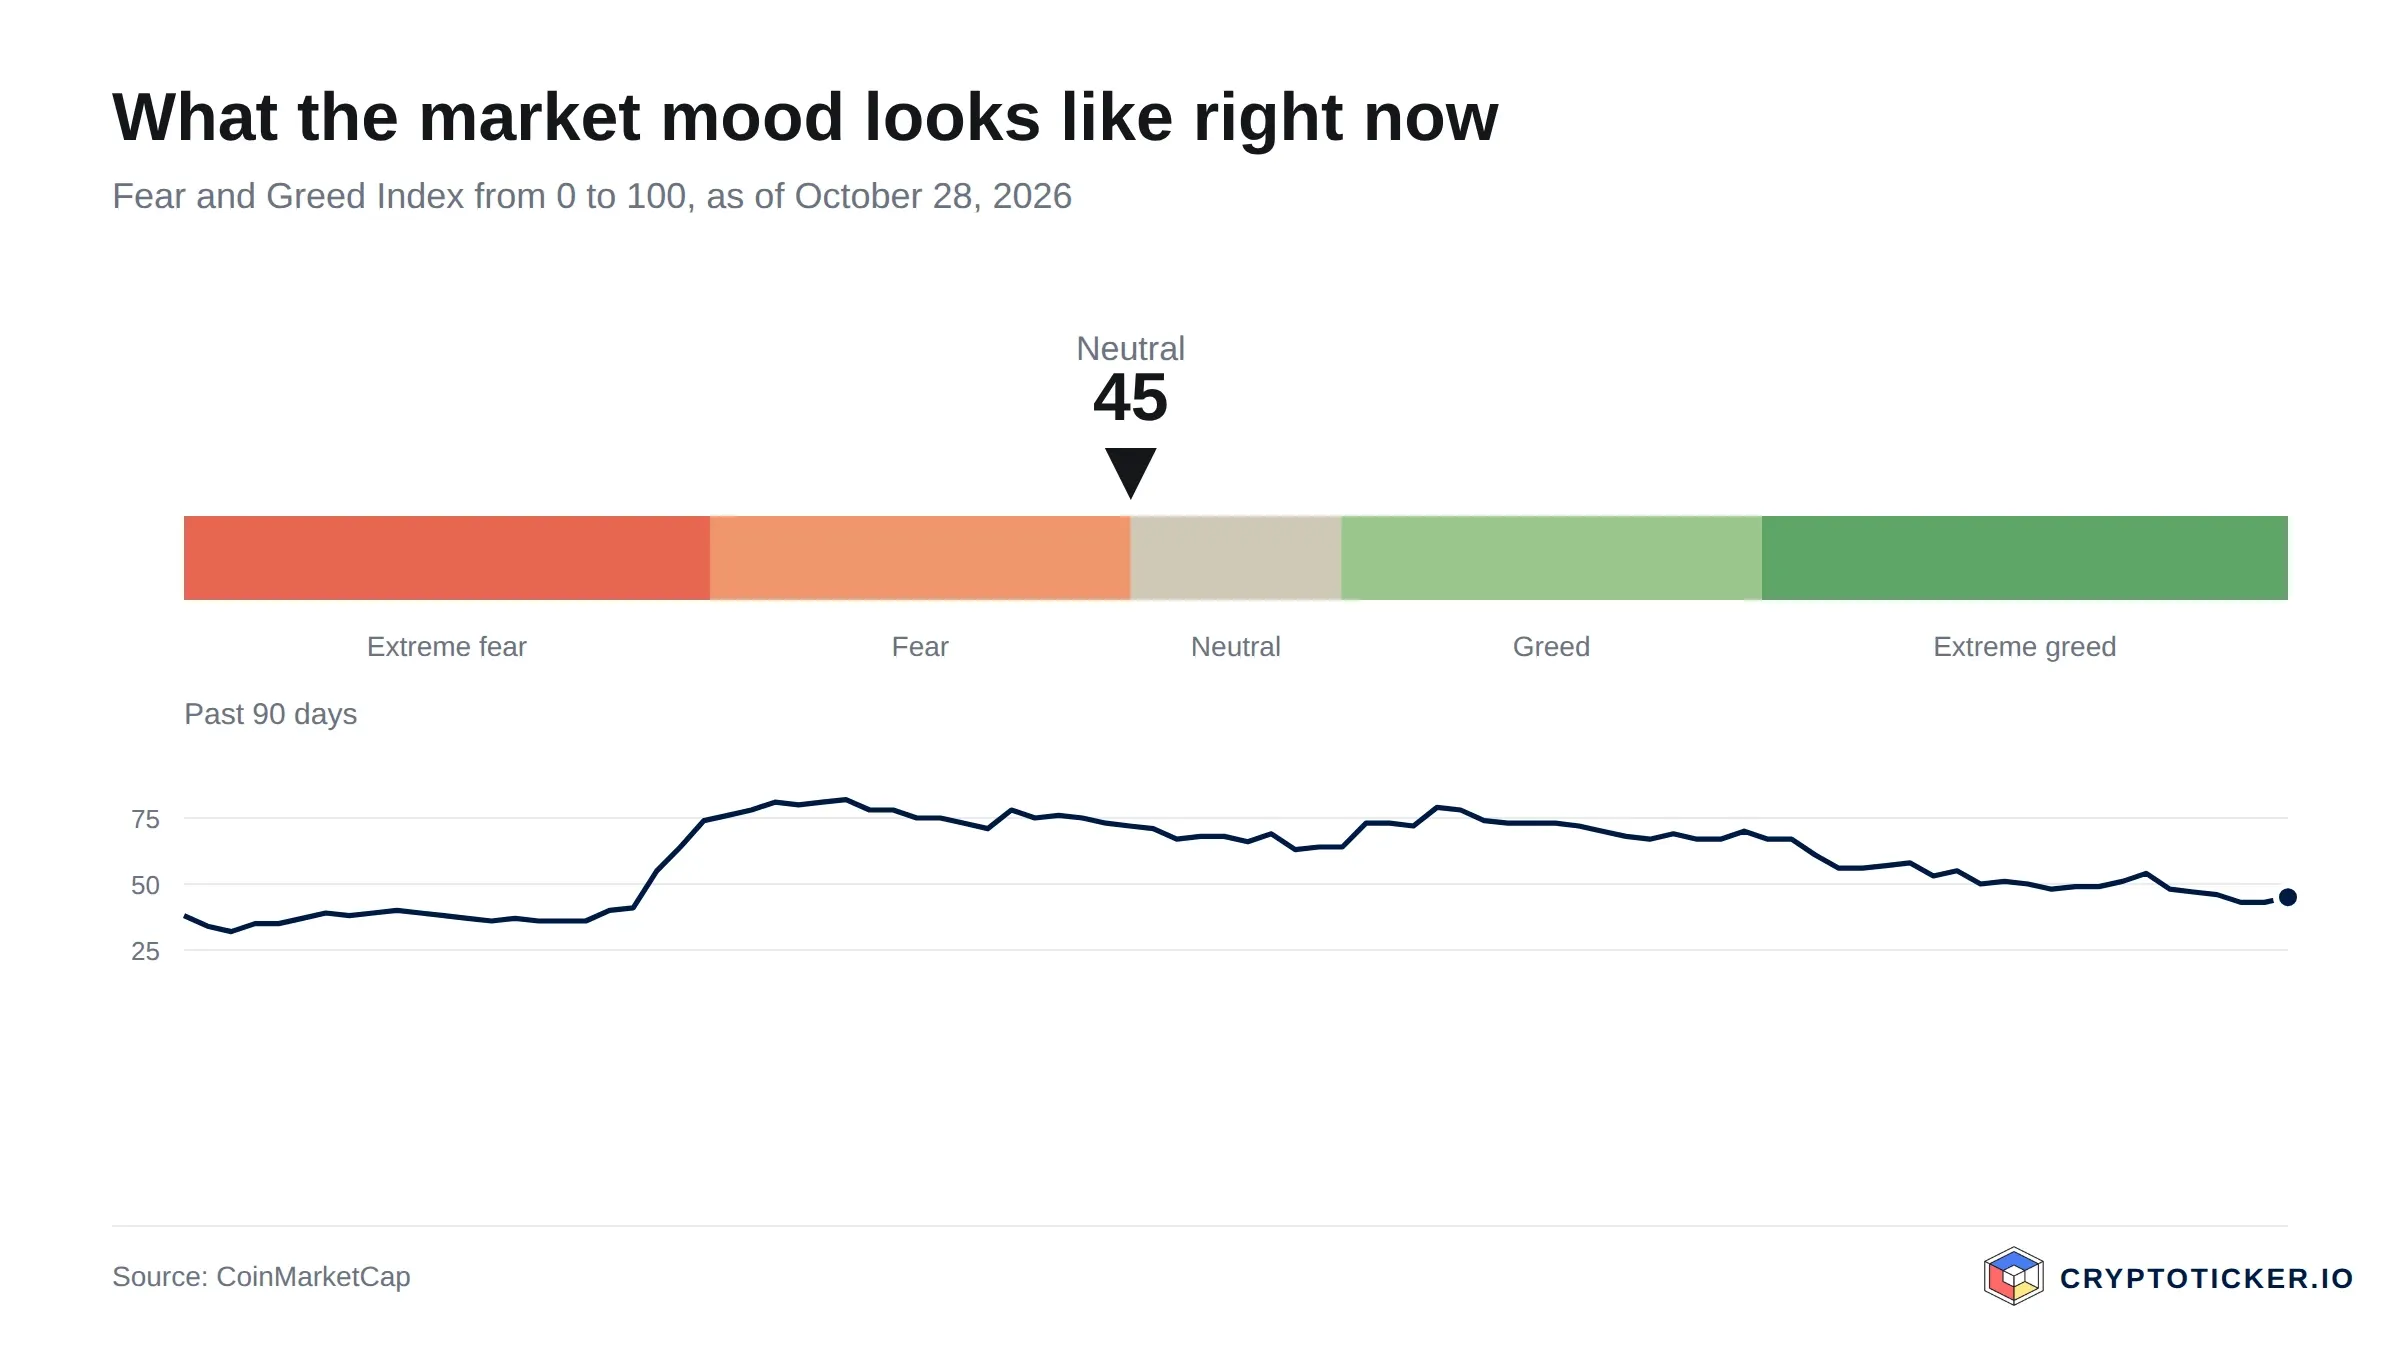
The wider market offers no help here either. The Fear and Greed Index stands at 46, which is neutral and says that neither panic nor euphoria is driving flows. A mid-cap asset at rank 59 tends to move with sentiment rather than against it, so the next leg has to come from the network JUST runs on rather than from a rising tide.
What RSI and moving averages mean for a JUST entry
The 14-day relative strength index reads 56.2, in the upper half of the neutral zone and well short of the 70 mark that signals an overbought market. On its own the figure gives a buyer nothing: it is neither the oversold reading that marks a discount nor the overheated one that warns of a snapback. Momentum is intact but not stretched.
The moving averages are more useful because they say something about structure rather than mood. The 50-day average at $0.1289 sits 27.9 percent above the 200-day average at $0.1008, and the faster line has been above the slower one for months. In practice that is the definition of an established uptrend, and it is the single strongest technical argument for JUST at current prices. It is also the argument that would fail first: if the price breaks and holds below $0.1289, the 50-day line turns from support into resistance, and the structure that justified the entry no longer exists.
For an entry decision, that gives you two numbers to write down rather than a signal to act on. The level that confirms the thesis is a daily close above $0.1426. The level that invalidates it is a weekly close below $0.1289. Between them, position size matters more than timing.
JUST trading volume: what it reveals about demand
JST turned over $37.4 million in the past 24 hours. Against a market capitalisation of $1.12 billion that is a turnover of 3.3 percent, which is respectable for a mid-cap token and enough to get in and out of a normal retail position without moving the price. It is not, however, the kind of volume that carries a breakout. Pushing through a ceiling at $0.1426 that has already rejected the price twice takes buyers who are willing to pay up, and that shows up as a volume expansion before the level breaks, not after.
So far that expansion has not appeared. Volume has stayed in its usual range through the whole consolidation, which fits the reading of the chart above: the market is working off supply rather than competing for the asset. Liquidity is adequate, but an entry into a quiet tape at the top of a range may sit flat for weeks.
Structural factors: what speaks for JUST as an investment
JUST is not a standalone network. It is a group of financial applications on the TRON blockchain, and JST is the token that governs them. The core is JustLend DAO, a market for deposits and loans where users supply assets to earn a yield and borrowers post collateral to take one out. Around it sit a stablecoin collateralised by TRX and a market for the network resources that transactions on TRON consume. The project documents the individual components on its own site, and the resource model behind them is described in the TRON developer documentation.
That architecture ties the value of JST to activity on TRON rather than to a narrative of its own. TRON carries a large share of global stablecoin transfers, and the fee and resource demand created by that traffic is what the JUST applications monetise. If payment volume on the network keeps growing, the lending market and the resource market grow with it. Our TRON price forecast covers that underlying network in detail; JST has no forecast page of its own, and the TRON page is the closest proxy for the demand side of this investment.
The supply side is unusually clean for a token of this size. Of a maximum supply of 9.9 billion JST, 8.02 billion are already in circulation, which is 81 percent. There is no large tranche due for release in the coming years that could quietly cap the price, and that removes a risk that burdens a great many tokens in the same capitalisation bracket.
Three arguments for buying JUST at current prices
The trend structure is intact. At $0.1392 the price stands above the 50-day average of $0.1289 and 38.1 percent above the 200-day average of $0.1008, with the faster line above the slower one. That is the configuration buyers normally wait for, and it exists right now.
The token earns its demand from measurable network use. Deposits and loans on JustLend DAO and the resource market on TRON generate activity that does not depend on a new narrative appearing. For a token at rank 59 that is a rarer quality than it should be.
The supply overhang is largely gone. With 81 percent of the maximum supply already circulating, a buyer today is not standing in front of years of scheduled unlocks. What the market has to absorb from here is profit-taking, which is finite, rather than new issuance, which is not.
Three arguments against buying JUST at current prices
You are buying two percent below a twelve-month high. At $0.1392 the price sits 2.4 percent under the $0.1426 ceiling and 308 percent above the $0.0341 low of a year ago. Every buyer who entered during the advance is in profit, and that supply has to be absorbed before the level gives way.
Volume does not support a breakout. A daily turnover of $37.4 million on a $1.12 billion capitalisation is enough for liquidity and not enough for a move through resistance. Without an expansion in volume, the probability of another rejection at $0.1426 is higher than the probability of a clean break.
The investment case runs through TRON, not through JUST. JST captures a share of activity on a network it does not control. A regulatory move against stablecoin transfers, or a shift of that traffic to a competing blockchain, would hit the JUST applications without anything inside the project going wrong. That is a dependency a buyer carries and cannot hedge.
Buying JUST: costs, custody and providers
JST is not listed everywhere, and the choice is narrower on regulated European platforms than on global exchanges, where TRON-based assets are more widely available. It is worth checking the listing before you plan a position rather than after. Our comparison of regulated crypto exchanges sets out which providers operate under European supervision and what that means for deposits, reporting and withdrawals.
On cost, the spread usually matters more than the headline trading fee for a token in this bracket, because it is paid twice: once on the way in and once on the way out. Among the platforms we have reviewed in detail, Kraken is the more trading-oriented option with deeper books, while Bitpanda is built around a simpler flow for buyers who want to hold rather than trade actively.
For custody the question is how long you intend to hold. For a position you expect to close within days, leaving the token on the exchange is a reasonable trade-off. For anything meant to last, a hardware wallet under your own control is the sounder arrangement, and our hardware wallet comparison covers which devices support TRON-based tokens. JST transfers consume TRON network resources, so a small TRX balance in the same wallet is a practical requirement.
So is JUST a good buy at current prices?
On a horizon of weeks the setup is undecided, and nothing in the data resolves it. An RSI of 56.2 gives no signal, the price is caught between support at $0.1289 and resistance at $0.1426, and the daily volume of $37.4 million is not sufficient to force the issue. Waiting for a daily close above $0.1426, or for a pullback to the 50-day average, costs nothing but patience.
On a horizon of years the answer depends on one variable, and it is not the chart. If stablecoin transfer volume on TRON keeps growing, the lending and resource markets that JST governs grow with it, and the 200-day average at $0.1008 will look like a floor. If that traffic migrates elsewhere, no technical structure will hold the price.
Here is the condition that would disprove the friendly reading: a weekly close below $0.1289 together with falling activity on JustLend DAO. The first alone is a correction inside a trend. Both together mean the demand side of the thesis has gone, and at that point the $0.1008 level is the reference, not the floor.
Buying JUST: The key points for your decision
- Write down both levels before you buy. Confirmation is a daily close above $0.1426; invalidation is a weekly close below $0.1289. Our TRON forecast tracks the network whose activity drives both.
- Check the listing and the order book, not just the fee. JST is thinner than its rank suggests on some venues, and the spread is the real cost. The regulated exchange comparison shows where the pair is available under European supervision.
- Decide custody with the holding period. Short trades can stay on the exchange; a long-term position belongs in your own wallet, with a small TRX balance for network resources. The hardware wallet comparison lists the devices that support TRON tokens.
Disclosure: Some of the providers mentioned in this article work with us through affiliate programmes. This has no influence on the price analysis or on our assessment of the chart; the price data come from a public market data source and can be verified there.
(As of 28 October 2026. This article is not investment advice. Prices, fees and terms change; check them with the provider before every purchase. Crypto assets are subject to high price swings, and a total loss is possible.)
0
0
 Manage all your crypto, NFT and DeFi from one place
Securely connect the portfolio you’re using to start.