
EGL1 Price Prediction: Will the 115% Breakout Keep Running?

0
0

Something odd is happening with a small token most traders had never even heard of a week ago, and now everyone wants in before it is too late.
Why Is Everyone Suddenly Talking About This Small Token
EGL1 price prediction talk is everywhere right now, and it started the moment this small token went from ignored to unavoidable. The coin jumped more than double in a single day, and that kind of move gets attention fast.
Turns out, this wasn't some slow grind higher. It happened almost overnight.
Traders who had this on a watchlist for weeks suddenly found themselves staring at a green candle bigger than anything the chart had shown in months, the kind of move that lands in the latest crypto news roundups fast. Basically, the token broke out of a long, sideways range with real volume behind it.
That's the part that makes this different from a random pump. Is this move built on anything that lasts, or is it a burst of speculative energy that fades as fast as it came?
Key Takeaways
-
Direction: Short-term bullish after a sharp breakout from a long consolidation zone.
-
Reason: A huge jump in trading volume pushed the price up more than 100% in a day.
-
Short-term range: Roughly $0.019 to $0.033 over the next one to three weeks.
-
Invalidation: A daily close below $0.0115 would break the bullish structure.
What Does The EGL1 Chart Look Like Right Now
| Metric | Data |
|---|---|
| Coin Name | EGL1 |
| Ticker Symbol | EGL1 |
| Blockchain | BNB Smart Chain (BSC) |
| Today High | $0.02752 |
| Today Low | $0.01146 |
| RSI Level | 93.76 |
| Token Type | Meme Token |
| Token Category | Community / Meme |
| Market Cap | $24.98 Million |
| 24H Trading Volume | $9.68 Million |
| 24H Trading Volume Change | +815.56% |
| Circulating Supply | 1,000,000,000 EGL1 |
| 24H Change | +115.03% |
Source: Data by CoinMarketCap
What Exactly Is This Coin And Who Made It
EGL1 runs on the BNB Smart Chain, marketing itself as a superhero-themed meme project leaning heavily on eagle and American branding.
It launched through the four.meme launchpad about a year ago and stayed a niche community token until this week.
Is This Rally Backed By Anything Real At All
And here's the thing: most of this move looks driven by liquidity rotation, not some new partnership or product launch. Money moving fast into low-cap tokens fits the same pattern behind the broader crypto market rally, and EGL1 caught a piece of that wave.
The holder count sits above 82,000 and jumped sharply in the last few days alone. That's real new demand, not just existing holders trading among themselves.
One wallet linked to the project account, EaglesLanding, reposted a Binance-related USD1 rewards campaign announcement this week, keeping the token grouped in conversation around top memecoins that traders were watching.
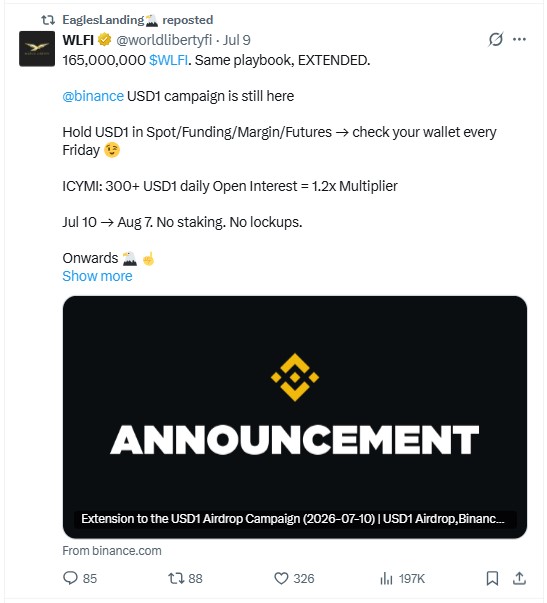
Source: Posted on X by EaglesLanding
$EGL1 Fundamental Analysis
Basically, EGL1 behaves like a low float meme token. Supply is fixed at 1 billion, so there's no unlock overhang.
CertiK rates the contract 4.1, decent for this category. Liquidity to market cap sits near 3.7%, thinner than typical Ethereum price coverage, so big orders move price sharply.
Technical Analysis: $EGL1 Breaks Out As RSI Hits Overbought Extreme
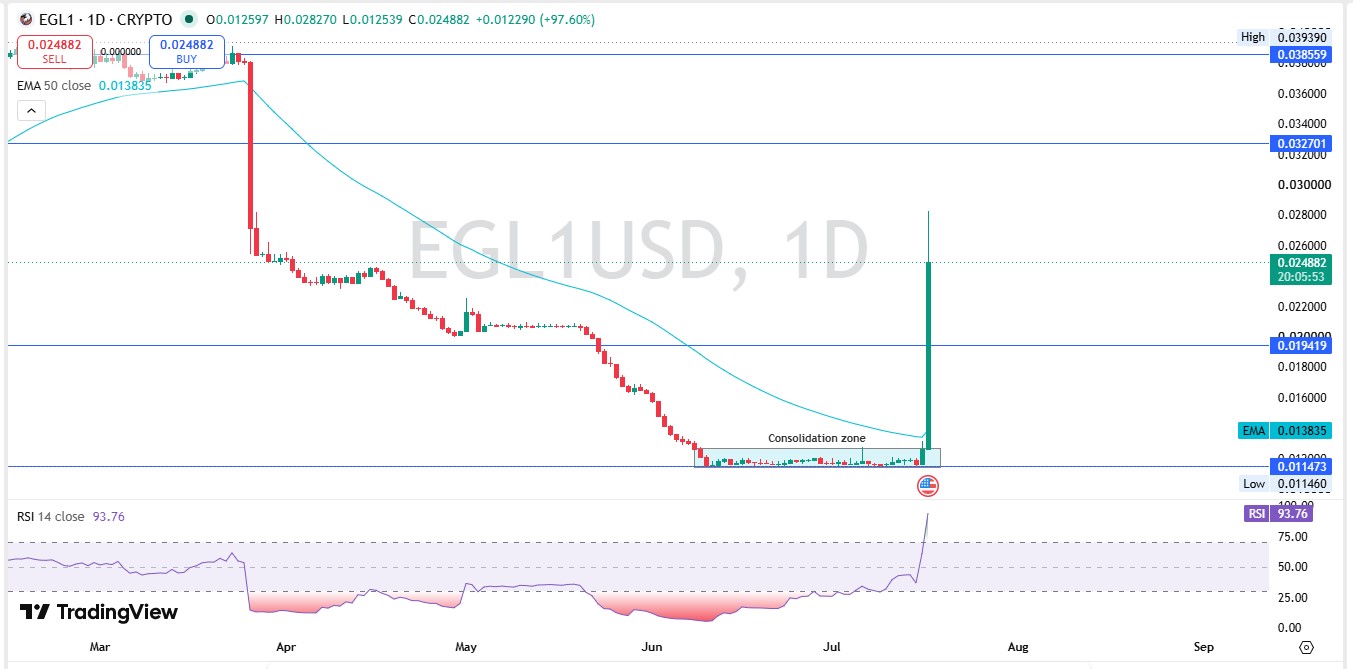
Price broke clean out of a multi-week consolidation zone near $0.0115, and that breakout is the real story, not the pattern alone. Volume exploded alongside it: $9.68 million traded in 24 hours versus a fraction of that before. This analysis is based on the 1-day timeframe.
Source: Charts by TradingView
Price now sits well above the 50 EMA at $0.013835, confirming short-term momentum has flipped bullish. RSI at 93.76 is deep in overbought territory, though, especially with the broader Bitcoin price staying far calmer by comparison.
There's no bearish divergence yet, but a reading this extreme rarely holds without a pullback.
Immediate support sits at $0.019419, the old breakout shelf.
Resistance stacks at $0.032701 and then $0.038559. A close below $0.011473 undoes the structure.
Where Could This Token Trade In The Next Few Days
In the short term, the path depends on whether buyers defend the breakout shelf or slip back into the old range, a pattern seen across the wider altcoin market in past weeks.
| Timeframe | Bearish Target | Base Target | Bullish Target | Key Trigger |
|---|---|---|---|---|
| 24 Hours | $0.0205 | $0.0248 | $0.0290 | Volume holding above $5M daily |
| 3-7 Days | $0.0175 | $0.0230 | $0.0327 | Weekly close above $0.0194 |
| 2-4 Weeks | $0.0150 | $0.0220 | $0.0386 | Sustained holder growth and volume |
Watch the $0.0194 level closely. Losing it fast would flip this from breakout to fakeout.
Can This Rally Actually Hold Up Months From Now
Longer term, this token still needs more than one good week to prove itself as anything beyond the kind of short-lived spike that fills up daily crypto price predictions coverage and fades just as fast.
| Timeframe | Bearish Target | Base Target | Bullish Target | Catalyst Needed |
|---|---|---|---|---|
| 3 Months | $0.010 | $0.020 | $0.045 | Continued exchange listing momentum |
| 6 Months | $0.008 | $0.025 | $0.060 | Sustained holder and volume growth |
| End of Year | $0.006 | $0.028 | $0.075 | New utility or ecosystem partnership |
| 2027 Outlook | $0.005 | $0.030 | $0.090 | Broader meme coin cycle turning bullish |
The honest take: the long-term case is weak until this project shows something beyond a viral chart move.
Three Ways This EGL1 Rally Could Go From Here
Worst Case: Momentum fades and profit-taking overwhelms new demand. Price slips back into the old $0.011 to $0.019 range.
Base Case: Price holds above $0.019 with choppy consolidation as buyers and sellers fight for control.
Best Case: Volume stays elevated and holders keep climbing. Price pushes through $0.0327 toward $0.0386.
| Scenario | Price Range | What Triggers It |
|---|---|---|
| Worst Case | $0.010 - $0.015 | Breakout support fails, volume dries up |
| Base Case | $0.018 - $0.025 | Sideways chop as market digests the rally |
| Best Case | $0.030 - $0.039 | Sustained volume and fresh holder growth |
Exact Price Levels Traders Are Watching Right Now
Resistance zone: $0.032701, the first real ceiling, followed by $0.038559 further up.
Support zone: $0.019419, the breakout level that needs to hold for this move to stay valid.
Invalidation zone: below $0.011473, a level that would erase the breakout structure.
Our Honest Take On Where This Token Goes Next
The setup right now leans more bullish than the extreme RSI reading alone suggests, worth saying plainly instead of hedging.
Structure favors continuation as long as $0.019419 holds on a closing basis. Below that, the thesis weakens fast.
And that raises a bigger question: one the market hasn't answered yet, whether this was a one-off liquidity event or the start of something the project can build on.
Risk is still real here. Thin liquidity relative to market cap means moves can happen fast, especially when the Fear and Greed Index swings widely for the broader market.
Keep an eye on holder growth alongside price, the same way capital has recently rotated between BTC and ETH among majors. Rising holders during a pullback is a healthier sign than price alone.
The chart says momentum. The fundamentals say caution. Both are true at once.
Disclaimer: This article is for educational purposes only and does not constitute financial advice. Crypto markets are volatile. Consult your investment advisor before making any investment decision.
0
0
 Manage all your crypto, NFT and DeFi from one place
Securely connect the portfolio you’re using to start.