
Uniswap Price Prediction: Can UNI Reclaim $6.785 Level?

0
0

Will Uniswap reclaim the $6.785 level or test the $5.347 level?
This Uniswap price prediction starts at $6.22, the Uniswap price at 05:40 UTC on Nov 12, 2026. Uniswap lost 6.5% in 24h. Traders who followed the earlier UNI setup now face a weaker tape.
Uniswap Price Forecast Snapshot
Uniswap trades at $6.22 per CoinGecko market data captured at 05:40 UTC on Nov 12, 2026.
Metric | Value |
Price | $6.22 |
24h change | -6.5% |
Market cap | $3.78B |
FDV | $5.51B |
24h trading volume | $562.65M |
Total value locked | $3.414B |
Circulating supply | 607.746M UNI |
Total supply | 886.006M UNI |
Max supply | 1B UNI |
Source: CoinGecko, UNI market snapshot, Nov 12, 2026, 05:40 UTC
Uniswap Elysium News Catalyst
Volume, the total value of trades processed, is the term in focus. Per the official Uniswap X post, Elysium went live Monday, Nov 9, 2026, and the graphic shows $200M in all-time Uniswap volume.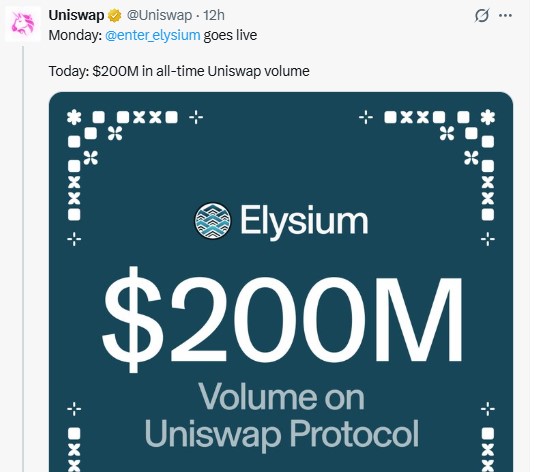
Source: Uniswap official X post, shown as 12h old, captured Nov 12, 2026, 05:40 UTC
Elysium is already live, so more Elysium-linked volume could keep reaching Uniswap. If that flow fades, the catalyst fades with it.
The Uniswap Elysium news hasn't lifted the price. Uniswap fell 6.5% over 24h on $562.65M of trading volume.
Uniswap Price Forecast: 24h Range
For this Uniswap price prediction, the 24h range sets the frame. UNI traded between $6.11 and $6.68 over the 24 hours to 05:40 UTC. The $6.22 price sits $0.11 above the low and $0.46 under the high.
A broad market dip, the kind tracked in the latest crypto market news, would explain the drop. But Uniswap also lost 6.2% against BTC in the same CoinGecko snapshot, so the weakness is mostly its own.
Uniswap Price Forecast and Whale Wallets
Per Etherscan holder data captured at 05:40 UTC on Nov 12, 2026, the Uniswap V2 timelock holds 26.22% of supply. The burn address holds 11.40%.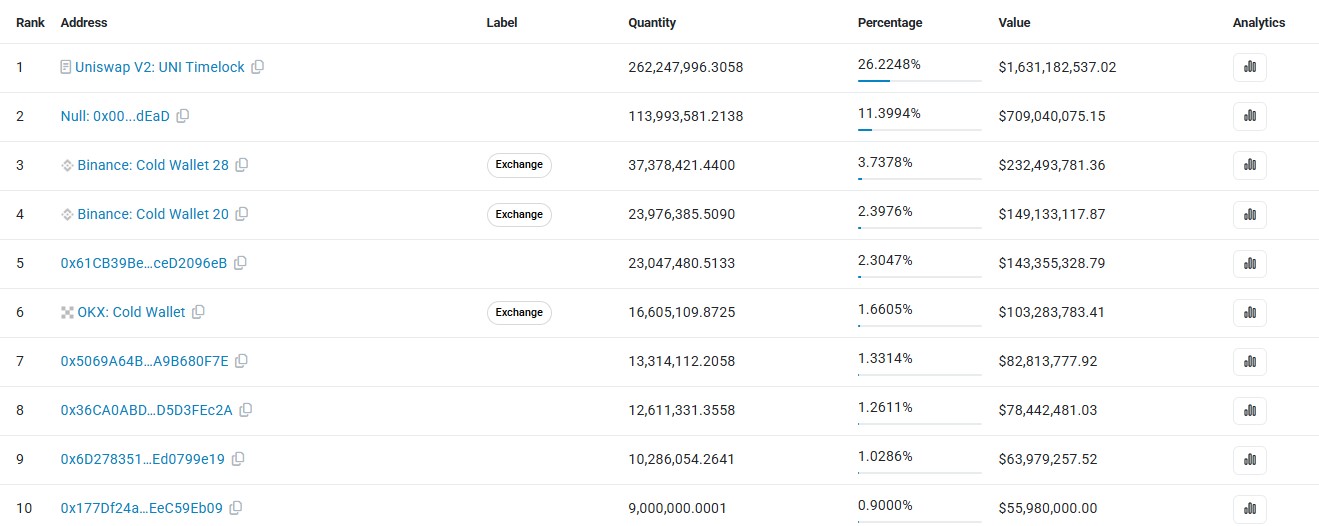
Source: Etherscan, UNI top holders, Nov 12, 2026, 05:40 UTC
Together, that's 37.62% sitting in a contract and a dead address, neither on an exchange. Exchange cold wallets add 7.80%.
Etherscan's holders overview puts the top 100 wallets at 80.70% and the top 10 at 52.24%.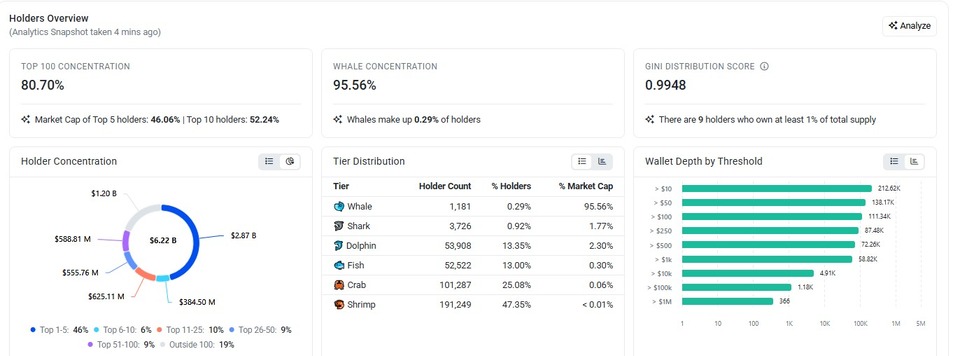
Source: Etherscan, UNI holders overview, Nov 12, 2026, 05:40 UTC
Whales are 0.29% of holders but own 95.56% of market cap. Nine holders own at least 1% of supply each. The Gini score, a 0 to 1 measure of uneven ownership, reads 0.9948.
Uniswap Liquidation Data
Longs took the beating. CoinGlass futures data at 05:40 UTC on Nov 12, 2026, logged $3.64M in UNI liquidations over 24h, with longs losing $3.44M, or 94%.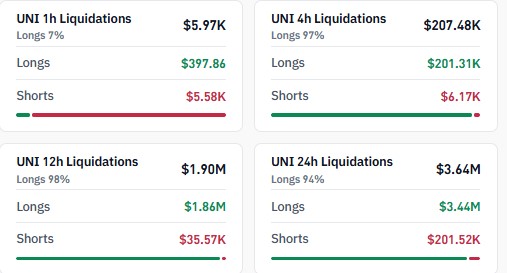
Source: CoinGlass, UNI liquidations, Nov 12, 2026, 05:40 UTC
A liquidation is a forced exit from a margin trade after losses eat the collateral. But the last hour flipped. Shorts lost $5.58K and longs just $397.86.
Uniswap Open Interest by Exchanges
Open interest is the total value of futures contracts still open. Per CoinGlass data at 05:40 UTC on Nov 12, 2026, Uniswap futures open interest totals $474.31M.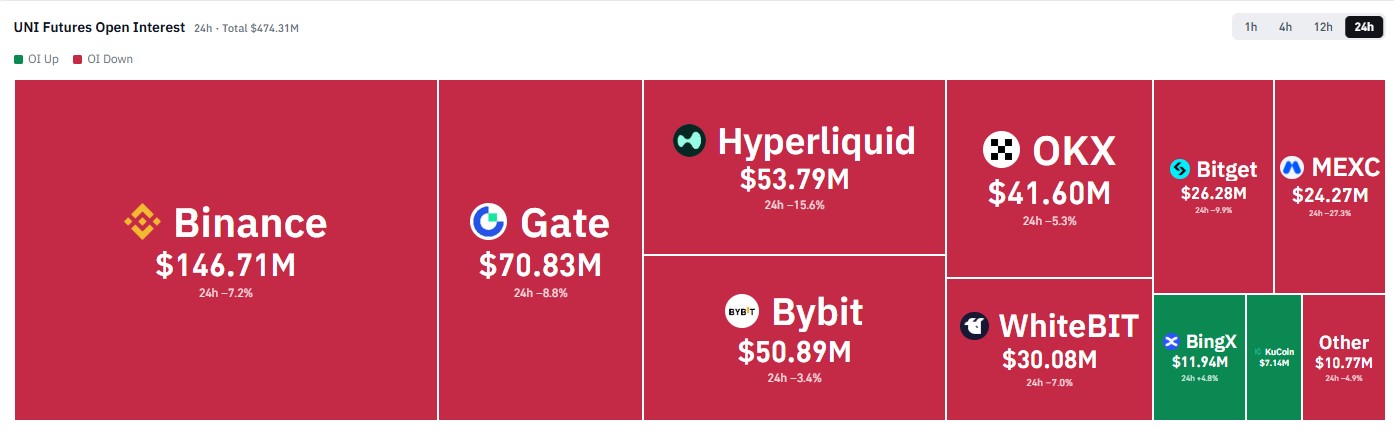
Source: CoinGlass, $UNI futures open interest, 24h, November 12, 2026, 05:40 UTC
Binance shows $146.71M open interest, down 7.2% over 24h. Gate shows $70.83M, Hyperliquid fell 15.6%, and MEXC shed 27.3%. Only BingX added, up 4.8%, so positions shrank on eight of nine venues, showing a change.
Uniswap Technical Analysis: RSI and 50-Day EMA Levels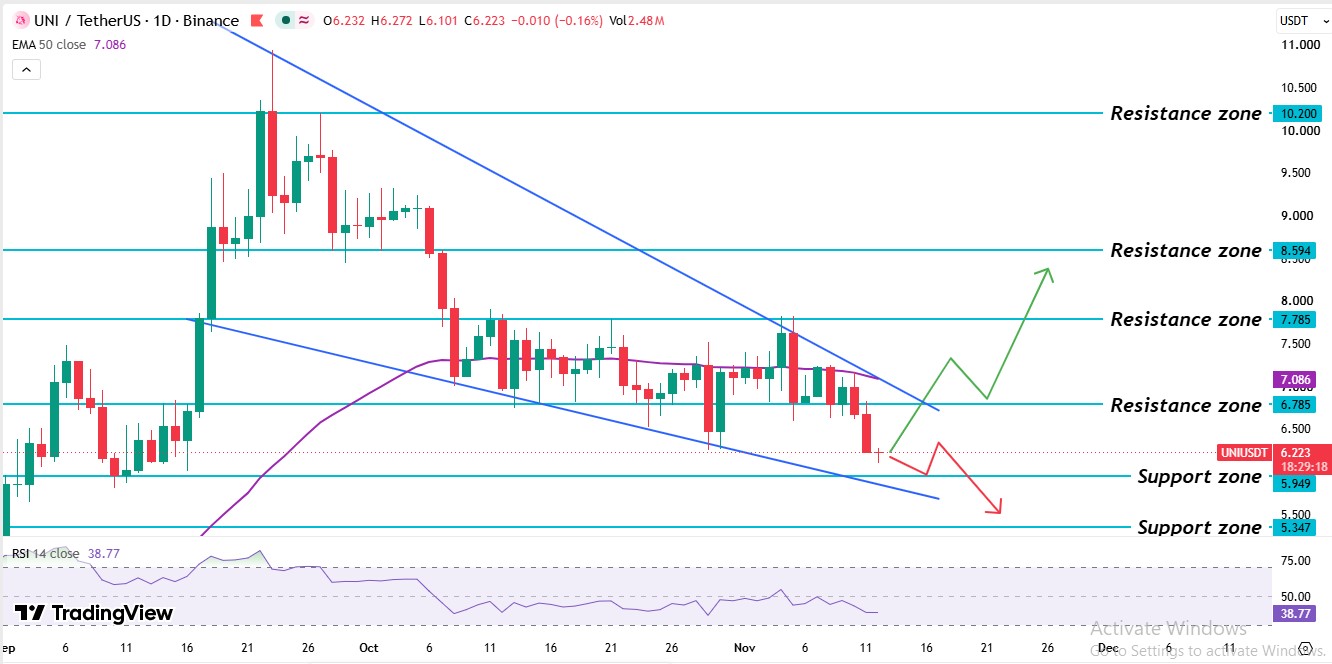
Source: TradingView, $UNI/USDT 1D, EMA 50, and RSI 14, November 12, 2026, 05:40 UTC
The Binance 1D chart for UNI/USDT on TradingView, captured Nov 12, 2026, 05:40 UTC, frames this Uniswap price prediction. A sharp September rally spiked above the $10.200 resistance zone before sellers took control.
Sellers pushed Uniswap down through October, under the $8.594 resistance zone. Price has since ranged below the 50-day EMA, an average of the last 50 daily prices that weights recent days more. A falling trendline, a line joining the lower highs since September, now caps Uniswap price action. The market tried many times to break it, but sellers defended the upper trendline of the wedge, most recently in early November.
Right now, UNI trades below the $6.785 resistance zone and the 50 EMA. It sits 4.36% above the $5.949 support zone, where buyers have stepped in, and earlier UNI support coverage gives context for that support level.
The $UNI 50-day EMA sits at $7.086, and Uniswap's $6.22 price trades 12.22% below it. The latest daily candle trades below it and the falling trendline sits near it, so recovery needs both levels.
The $UNI RSI reads 38.77 on the 14-day setting, and it rose above 70 in September. Under 50 means sellers hold the momentum edge. Above 30 means oversold conditions haven't formed, so the price has room to fall.
UNI Support Levels and Resistance Levels
Level | Type |
$5.347 | Support |
$5.949 | Support |
$6.785 | Resistance |
$7.086 | 50-day EMA |
$7.785 | Resistance |
$8.594 | Resistance |
$10.200 | Resistance |
UNI Bull, Base and Bear Scenarios
Scenario | Trigger | Target | Invalidation |
Bull | Trades above the $7.086 EMA level | $7.785 | Under $6.785 |
Base | Holds between $5.949 and $6.785 levels | Range Trade | Break of either level |
Bear | Trades under $5.949 | $5.347 | Above $6.785 |
Risks sit in four places: fading Elysium-linked volume, whale selling, fresh long liquidations, and a technical break under $5.949.
Uniswap price prediction: Expert Outlook
According to CoinGabbar analysis, this Uniswap price prediction stays bearish below the $7.086 EMA. The RSI reads 38.77; long liquidations hit $3.44M, and open interest fell at eight of nine venues. Elysium is live, yet whales hold 95.56% of market cap.
The $6.785 level is the one to watch. A daily candle trading above it means sellers have lost their range top, and the EMA comes into play.
Disclaimer: This article is for information only and isn't financial advice. Traders should do their own research and risk only what they can afford to lose.
0
0

 Manage all your crypto, NFT and DeFi from one place
Securely connect the portfolio you’re using to start.


