
Fed Rate Bets: Why Are Bitcoin, Ethereum and XRP Prices Falling Today?

0
0

The crypto market is under pressure before the Fed Rate decision on Wednesday, October 28. Total market value slipped 1.03% to about $2.66 trillion as traders cut risk.
Bitcoin lost the $80,000 level over the weekend.
Why Is the Crypto Market Down Today?
Coin | Price | Latest Move |
Bitcoin | Below $80,000 | Low near $79,300, rejected near $81,000 |
Ethereum | $2,318.68 | -0.96% |
XRP | $1.28 | -1.45% |
Solana | $100.66 | -0.58% |
How Will the Fed Meeting Affect Bitcoin and Crypto?
CME FedWatch shows a 90.6% chance the Fed holds rates at 3.75% to 4.00%. A 25-basis-point hike has a 9.4% chance. Easing sits at 0%.
Timeframe | Hold (3.75%-4.00%) | Hike (4.00%-4.25%) |
Now | 90.6% | 9.4% |
1 day ago (Oct 23) | 90.0% | 10.0% |
1 week ago (Oct 16) | 84.5% | 15.5% |
1 month ago (Sep 25) | 35.8% | 64.2% |
A hold is now mostly priced in. Source: CME FedWatch.
So the words around the Fed Rate call may matter more than the call itself.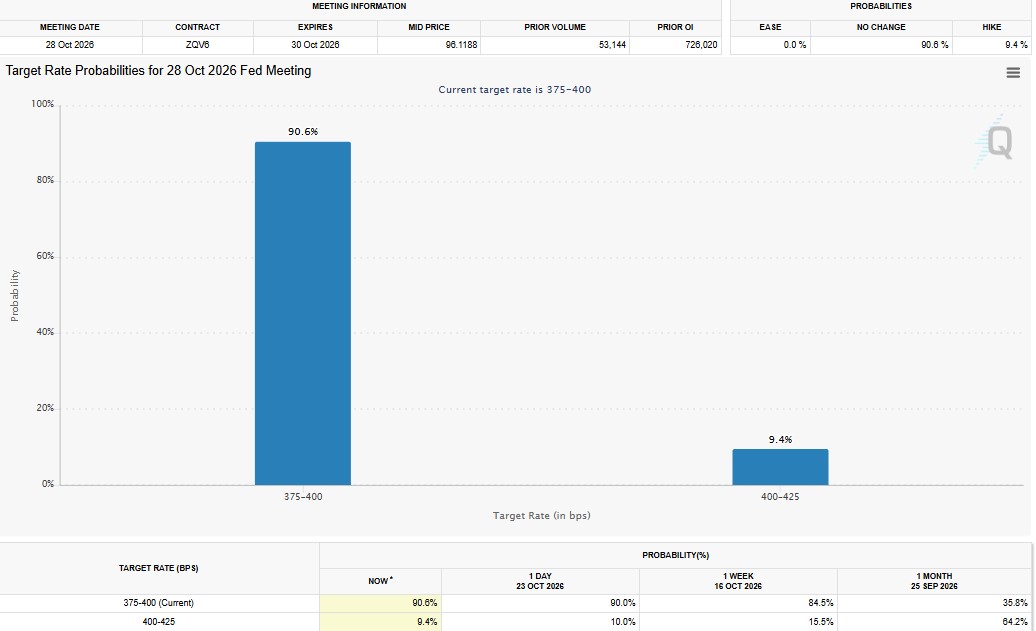
What Is Coming in Crypto This Week?
Date | Event |
Oct 28 | FOMC decision and Kevin Warsh press conference |
Oct 29 | US PCE inflation and GDP data |
Oct 30 | Japan unemployment data and BOJ rate decision |
All week | 35% of S&P 500 companies report earnings |
What Are the Bitcoin Support and Resistance Levels?
BTC trades below the 20-day EMA at $81,846 and the 50-day EMA at $80,733. RSI is near 41, which shows weak momentum.
Level | Type | Note |
$84,000 to $87,404 | Resistance | Range top |
$82,500 | Resistance | Floor lost last Thursday |
$80,700 to $81,850 | Resistance | 50-day and 20-day EMA |
$79,000 to $78,000 | Support | Immediate zone |
$77,629 | Support | 100-day EMA |
$76,300 to $74,000 | Support | 200-day EMA, next target |
Where Could Bitcoin Go Next?
If $79,000 to $78,000 breaks, a slide toward $76,300 to $74,000 is possible. A move toward $76,000 would signal a real downtrend.
If buyers reclaim $80,700 to $81,850, the way to $84,000 to $87,400 opens.
Recent sessions have repeatedly targeted leveraged retail positions. Liquidity clusters sit near $81,500, $79,000, and $78,800. Sellers are in control, so a sweep lower may come first.
A firm tone on the Fed Rate path could add pressure. A calm one may help buyers. Nobody knows yet.
How Many Crypto Liquidations Happened Today?
CoinGlass says 61,207 traders were liquidated in 24 hours. Longs took 73.8% of the losses.
Period | Total | Long | Short |
1 hour | $11.19M | $8.95M | $2.23M |
4 hours | $21.97M | $13.42M | $8.55M |
12 hours | $114.80M | $95.51M | $19.30M |
24 hours | $160.78M | $118.71M | $42.07M |
Coin | 24h Liquidations | Side |
Ethereum | $43.39M | 72.5% long |
Bitcoin | $36.11M | 75.5% long |
Others | $17.08M | 82.1% long |
XYZ:EWZ | $12.16M | 99.6% long |
Solana | $5.34M | Mostly long |
Zcash | $5.03M | Mostly short |
APR | $3.66M | Mostly long |
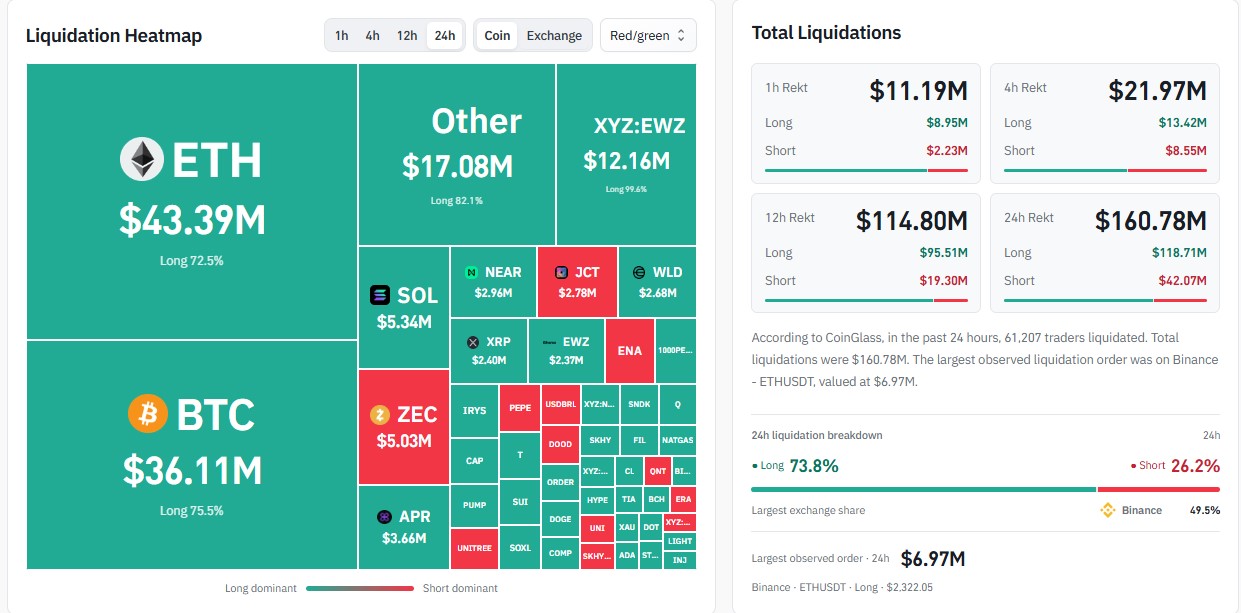
Source: CoinGlass. Binance had 49.5% of the total. The largest order was a $6.97 million ETHUSDT long at $2,322.05.
What Is the Crypto Fear and Greed Index Today?
Time | Score | Mood |
Now | 50 | Neutral |
Yesterday | 54 | Neutral |
Last week | 59 | Greed |
Last month | 74 | Greed |
Sentiment cooled from strong greed to neutral in a month. Source: alternative.me, updated Oct 26, 2026.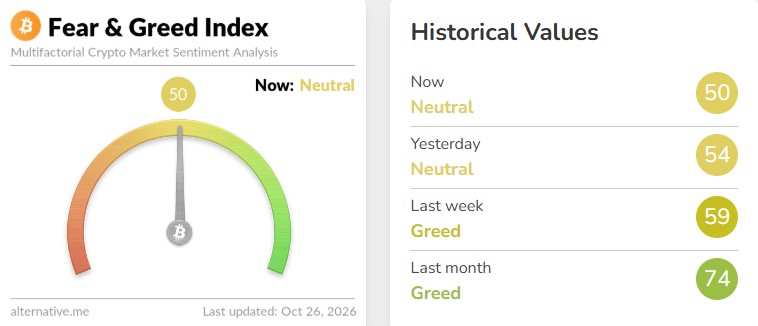
What Are the Ethereum Support and Resistance Levels Today?
ETH was rejected near $2,700 to $2,780 and has made lower highs. It slipped under the rising trendline from the July low.
Price sits below the 20-day EMA at $2,441 and the 50-day EMA at $2,459. It is near the 100-day EMA at $2,363 and the 200-day EMA at $2,318.90. RSI is 33.79, close to oversold.
Level | Zone | Why It Matters |
Resistance 2 | $2,500 to $2,550 | Relief rally target |
Resistance 1 | $2,360 to $2,460 | EMA zone bulls must reclaim |
Support 1 | $2,300 to $2,280 | Immediate floor |
Support 2 | $2,220 | Next stop if support breaks |
Support 3 | $2,150 | Deeper downside |
Will Ethereum Rebound or Drop Further?
If buyers defend $2,300 to $2,280 and reclaim $2,360 to $2,460, a rally toward $2,500 to $2,550 could follow.
If ETH breaks below $2,280 and stays there, $2,220 and $2,150 come into view.
What Are the XRP Support and Resistance Levels?
XRP trades near $1.28. Ali Charts says $1.26 is the lower edge of a channel forming since August. The 4-hour chart marks it with an arrow.
Level | Type |
$1.62, $1.52, $1.43, $1.34 | Resistance |
$1.26 | Support (channel line) |
$1.11 | Support (first target) |
$0.98 | Support (channel target) |
Can XRP Fall to $0.98?
The bearish case rests on fewer large wallets, higher exchange balances, and a break below $1.26.
If $1.26 fails, $1.11 comes first, about 12% lower. The channel then points to $0.98, about 22% below $1.26.
If $1.26 holds, XRP could stay between $1.26 and $1.34 for a while. None of this is certain.
Disclaimer
This article is for information only and is not financial advice. Crypto is volatile, and losses are possible. Do your own research before investing.
0
0


 Manage all your crypto, NFT and DeFi from one place
Securely connect the portfolio you’re using to start.
 Where will Bitcoin trade next?
Live Polymarket and Kalshi odds on Bitcoin price targets, compared side by side.
See Bitcoin price odds


