
Bitcoin Price Forecast: Is BTC Heading to $78K After $263M Wipeout?

0
0

Bitcoin price today is near $82,350, down 0.54% on the day. The coin dipped close to $80,000 yesterday, then climbed back above $82,000.
Crypto has seen unexpected selling for four days. The total market cap is below $2.80 trillion, down 1.11%. The price has felt that pressure more than most.
Bitcoin Price Today: What Do the Latest BTC Numbers Show?
Here is a quick look at the derivatives data.
Metric | Value | 24h Change |
Price | $82,350.5 | -$447.11 (-0.54%) |
Market cap | $1.65 trillion | n/a |
Circulating supply | 20.09 million BTC (max 21 million) | n/a |
Futures volume | $78.69 billion | +30.08% |
Spot volume | $6.95 billion | n/a |
Open interest | $52.68 billion | -2.43% |
Options volume | $7.62 billion | +53.45% |
Options open interest | $38.98 billion | +3.95% |
Long/short ratio | 0.9497 | n/a |
Futures volume jumped, but open interest fell. That often means traders are closing positions, not adding new ones.
The overall long/short ratio is 0.9497. This points to slightly more short positions across the market.
Exchange data tells a different story.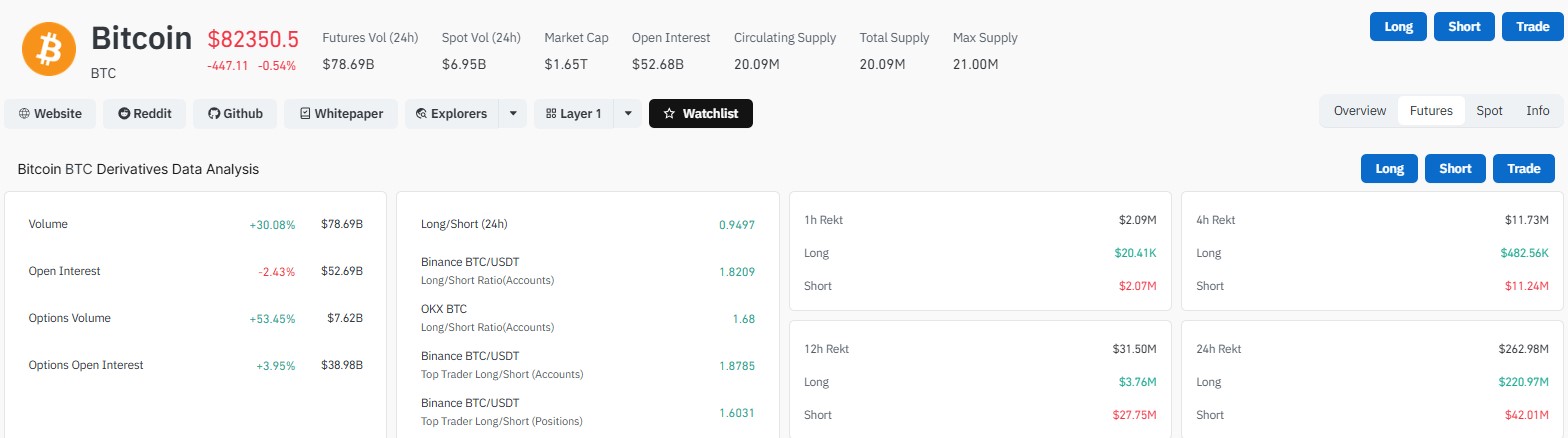
Exchange Data | Long/Short Ratio |
Binance BTC/USDT (accounts) | 1.8209 |
OKX BTC (accounts) | 1.68 |
Binance top traders (accounts) | 1.8785 |
Binance top traders (positions) | 1.6031 |
Most accounts on these exchanges lean long. The mixed readings show traders are split.
Why Is BTC Price Dropping Today?
A few things are hitting at once. Rising oil prices, higher Treasury yields, and a firm dollar are weighing on risk assets. Leveraged traders are also getting wiped out.
Crypto has been under pressure for 7 days. The asset slipped to $81.8K at one point, and altcoins were punished even harder.
Total liquidations reached $262.98 million in 24 hours. Longs lost $220.97 million. Shorts lost $42.01 million.
Window | Total Liquidated | Longs | Shorts |
1 hour | $2.09M | $20.41K | $2.07M |
4 hours | $11.73M | $482.56K | $11.24M |
12 hours | $31.50M | $3.76M | $27.75M |
24 hours | $262.98M | $220.97M | $42.01M |
Look at the shorter windows. Shorts took most of the recent losses, which fits the bounce from $80,000. The heavy long wipeout came earlier.
Bitcoin News Today: Are ETF Outflows and US Transfers Hurting BTC?
On October 8 (ET), U.S. spot ETFs recorded net outflows of $244 million. Only Franklin's EZBC reported a net inflow.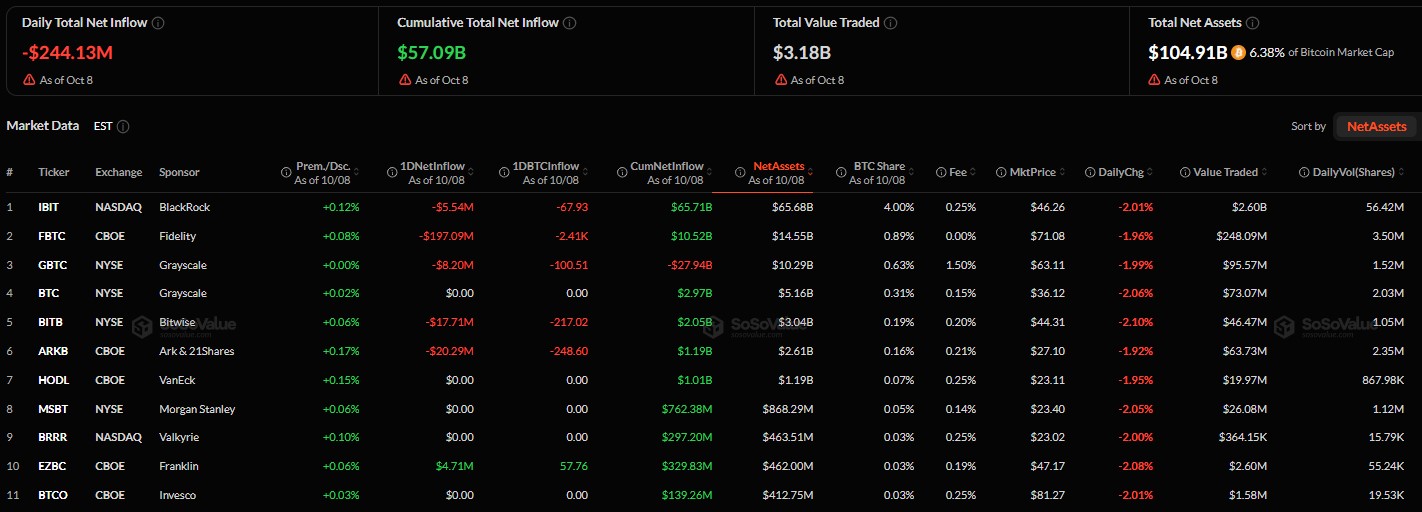
The U.S. government deposited 17,733 $BTC ($1.48B) and 750 $WBTC ($62M) into CoinbasePrime over the past 3 days.
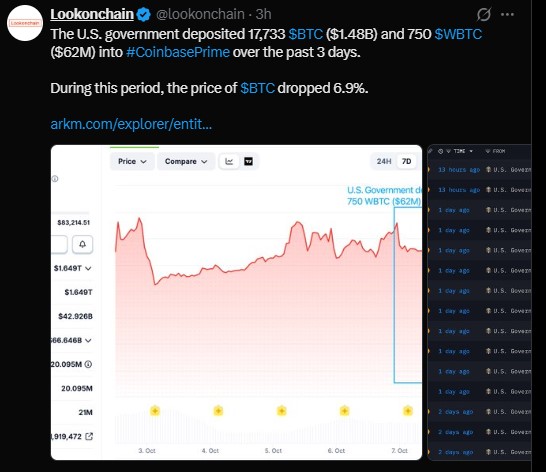
A transfer is not a sale. Still, the market tends to react first and ask questions later.
Is Bitcoin Profit Taking at a Peak?
Santiment says holders locked in about $1.03 billion in realized profit. That is the second-highest day of 2026. The year's peak is $1.04 billion. Earlier spikes on the chart were about $646 million and $950 million.
It came after the price climbed above $87,000. Many holders chose to cash out near that area.
Realized profit tracks gains investors actually take when coins move on-chain. Big spikes often show up during cooling periods. They do not guarantee a major reversal, but they show the rally is being tested.
Bitcoin Price Prediction: What Are the Key Support and Resistance Levels?
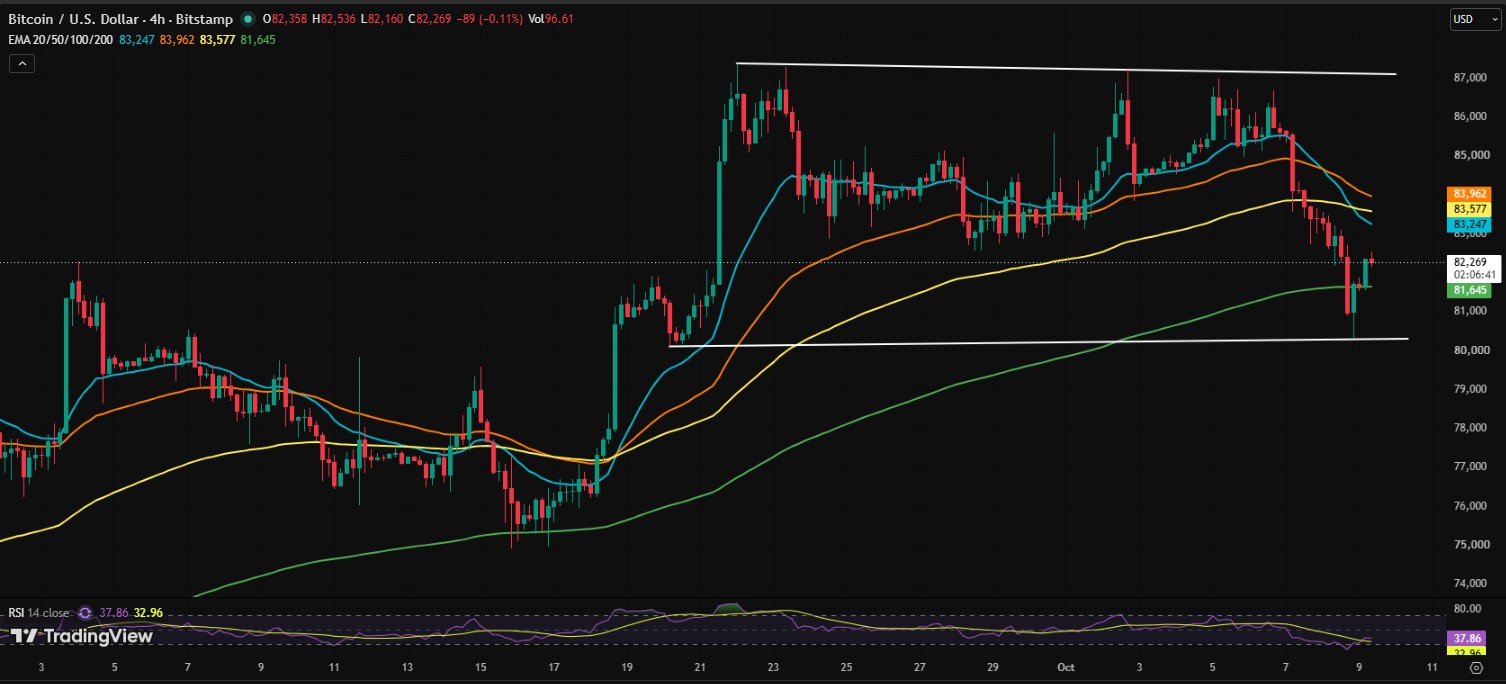
This BTC price prediction starts with the 4-hour chart, which looks bearish in the short term. $BTC was rejected several times near $86,500 to $87,000. That has formed a double top with a neckline at $81,000.
Price is also below the 20, 50, and 100 EMAs. The RSI sits near 38, so sellers still have control. A short-term relief bounce is still possible.
Level | Role | What It Means |
$86,500 to $87,000 | Strong resistance | Repeated rejections so far |
$85,000 | Recovery target | Possible if buyers hold support |
$83,200 to $84,000 | Resistance | Bulls need to reclaim this |
$81,500 to $82,000 | Key watch zone | Losing it opens more downside |
$81,000 | Double top neckline | A break adds bearish pressure |
$80,000 to $80,300 | Main support | Buyers must defend this |
$79,000 | First downside target | Below $80,000 |
$77,500 to $78,000 | Next downside target | Matches the $78,000 call |
$75,000 | Deeper support | Could be tested before any strong uptrend |
$72,000 to $70,000 | Worst case | If the neckline breaks hard |
Bitcoin Price Forecast: Will BTC Hit $78,000 This Month?
Some analysts expect $78,000 this October. That is possible if $80,000 breaks and the government transfers keep adding worry.
The bullish case is simpler. If buyers defend support and reclaims $83,200 to $84,000, a move toward $85,000 opens up. Stronger resistance waits near $86,000 to $87,000.
For now, the chart leans bearish to neutral. That changes only if BTC wins back the EMA cluster. A clear close below $80,000 would make the bearish case stronger.
Nobody can say which way it breaks. The market is at a decision point.
BTC News Today: What Should Traders Watch Next?
In BTC news today, the $81,500 to $82,000 zone matters most. Losing it could drag price toward $75,000. It is the line between a bounce and a deeper slide.
Then check ETF flows, since another outflow day would add pressure. Also track any new US government wallet moves, along with oil prices and Treasury yields.
Disclaimer
This article is for information only. It is not financial, investment, or trading advice. Crypto prices are very volatile, and you can lose money. Prices and data can change fast. Do your own research and speak with a licensed financial advisor before making any decision.
0
0


 Manage all your crypto, NFT and DeFi from one place
Securely connect the portfolio you’re using to start.


