
Pi Network Price Prediction: PI Hit July Lows! Is a Big Comeback Next?

1
0

Pi Network is back at its July price, and one tweet sums up the mood: is this the end, or will PI bounce back? Pioneers have waited a long time, while others say the bigger picture is just beginning.
Last time PI sat near this level, it climbed in the weeks that followed. Those who sit out now may miss the next move. This Pi Network price prediction checks if history may repeat.
Chart data checked on October 21, 2026.
Why is PI Network price up today?
Pi Network price today is up 2% to $0.07912 in 24h, outperforming a broadly positive market, primarily driven by a modest beta-driven lift amid a lack of coin-specific catalysts.
Primary reason: Beta-driven market lift, as Pi moved in sync with a broader crypto market gain of 1.01%, though it decoupled from Bitcoin's more modest rise.
Secondary reasons: No clear secondary driver was visible in the provided data; social sentiment was mildly bullish but not extreme, and no major news, ecosystem updates, or unusual volume spikes were evident.
What could affect PI future price?
Pi's price faces headwinds from supply inflation but upcoming utility development offers a potential path forward.
Ecosystem & Developer Momentum – The first Pi Ecosystem Summit in November 2026 could showcase new tools and apps, driving utility-based demand if execution is strong.
Tokenomics & Supply Pressure – With a 100B max supply and ongoing migrations, significant daily token unlocks create persistent sell-side pressure that outpaces current demand.
Regulatory & Market Legitimacy – Progress with the EU's MiCA framework filing could enhance institutional trust, while thin exchange liquidity amplifies price volatility.
Pi Network News: PI Slides Back to July Levels
A post on X says PI has hit rock bottom again and now trades near its July 2026 low. It says pioneers (Pi's name for its community members) are still waiting for a price move despite many announcements and upgrades.
The post puts PI down 62% over the past year and nearly 10% over the past 30 days. It ends by asking whether this is the end or a bounce is coming.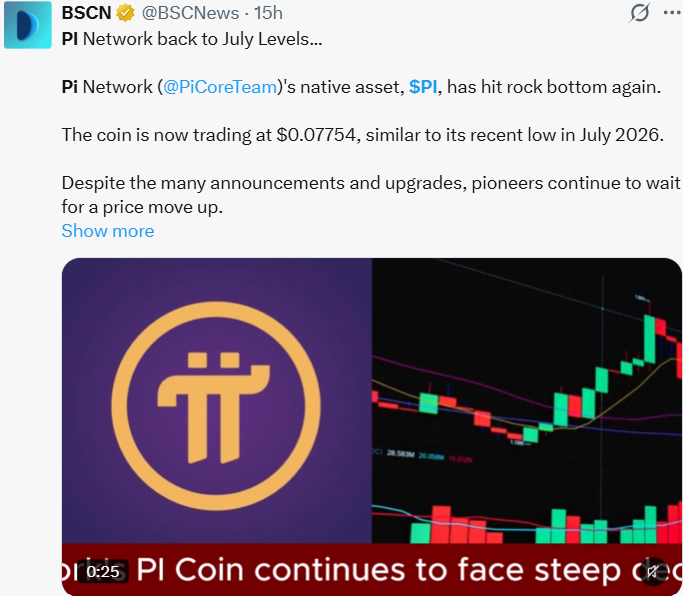
Source: Data From X
CoinGabbar could not independently verify these figures.
PI News: Community Stays Bullish on Pi Ecosystem
It argues that Pi's millions of users, growing utility and active developers point to a much bigger future.
The writer says the real question is how far Pi can go if real-world adoption speeds up. This is a personal opinion and not a confirmed development. Source: Data From PI News
It adds no new price data, so the chart below is the better guide.
PI Technical Analysis
PI fell from near $0.13 in early July to the $0.075 area by mid-July. It then moved sideways between roughly $0.075 and $0.10.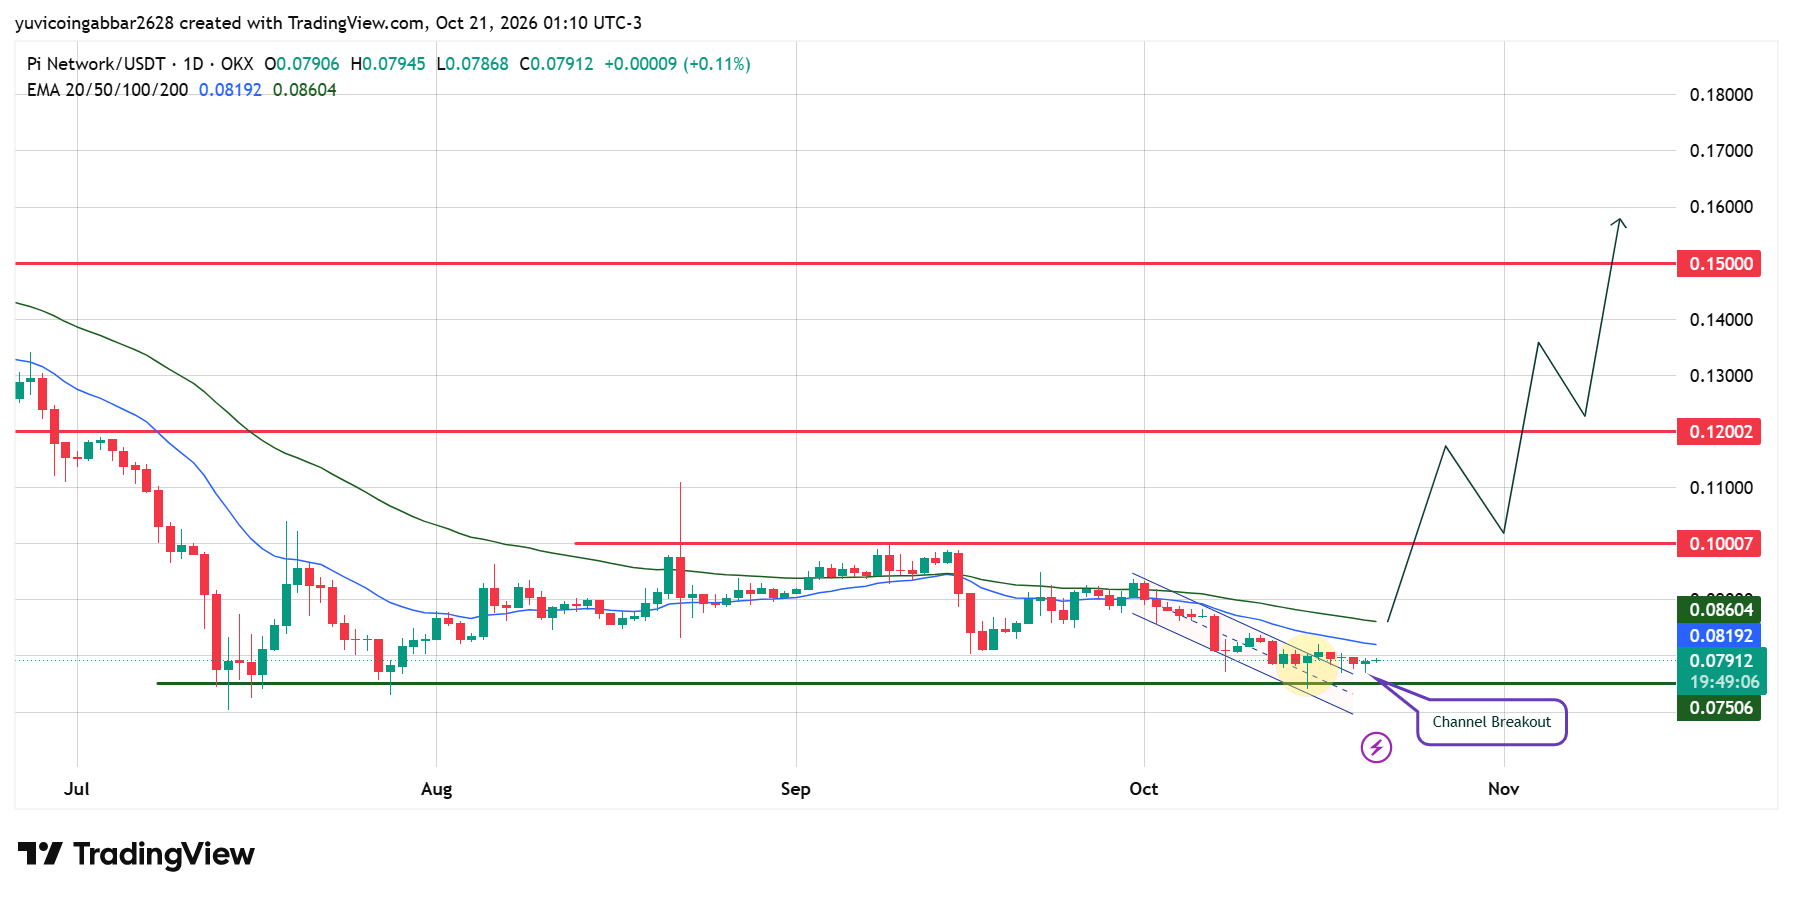
Since early October, the price has slid inside a falling channel.
The price has broken out of the channel but failed to sustain the breakout and is now trading just above key support.
The key level to watch is whether support holds, as a sustained hold could support another bullish move. However, a break below support would weaken the bullish structure and increase the risk of further downside.
The 20-day EMA sits at $0.08192 and the 50-day EMA at $0.08604, so both act as hurdles for now.
Support
$0.07506 is the key support, marked on the chart close to the July lows. No lower level is marked on the chart.
A daily close below $0.07506 would leave PI without a visible floor on this view.
Resistance
The first hurdles are the 20-day EMA at $0.08192 and the 50-day EMA at $0.08604. Above those, the chart marks $0.10007 as the top of the August-September range.
Further levels sit at $0.12002 and $0.15000. This PI price outlook depends on how the price reacts around the EMAs first.
Pi Forecast: Triggers and Invalidation
Scenario | Trigger | Likely Outcome | Invalidation |
Bull case | Daily close above $0.08604 | Move toward $0.10007, then $0.12002 | Daily close below $0.07506 |
Base case | Price stays between $0.07506 and $0.08192 | Sideways base forms | Close above $0.08604 or below $0.07506 |
Bear case | Daily close below $0.07506 | Weakness with no marked level below | Close back above $0.08192 |
Pi Network Price Prediction: Can PI Reach $0.15 Again?
$0.15000 is the highest level marked on the chart, about 90% above the current price. PI would first need to clear both EMAs, then $0.10007 and $0.12002.
The upward arrow drawn on the chart is a sketch of a possible path and not a forecast. Nothing on the chart suggests this would happen quickly.
Pi Network Price Prediction 2026: Expert Analysis
According to CoinGabbar analysts, the downtrend stays in place until PI closes above the EMAs, and the bounce from the September drop shows how easily rallies here can fade.
Strong community talk does not change what the chart shows today.
Disclaimer
This article is for informational purposes only and isn't financial advice. Crypto markets are volatile. Always do your own research before making any trading decisions involving PI.
1
0


 Manage all your crypto, NFT and DeFi from one place
Securely connect the portfolio you’re using to start.


