
Here’s Why ETH Price Recovery Could Extend to $2200
0
0

The post Here’s Why ETH Price Recovery Could Extend to $2200 appeared first on Coinpedia Fintech News
The leading cryptocurrency Bitcoin struggling to surpass the $38,000 mark and delayed approval from the U.S. SEC for some Bitcoin spot ETF has led to a correction in ETH price after hitting a monthly barrier of $2137. Within a fortnight, the coin price has plunged 6% to currently trade at the $2008 mark.
However, this correction could be a minor pullback before the Ethereum price takes the next recovery leap, indicating the ETH price prediction has a bullish outlook for the near future
Healthy Retracement Keeps Ethereum Recovery Intact
Source- Tradingview
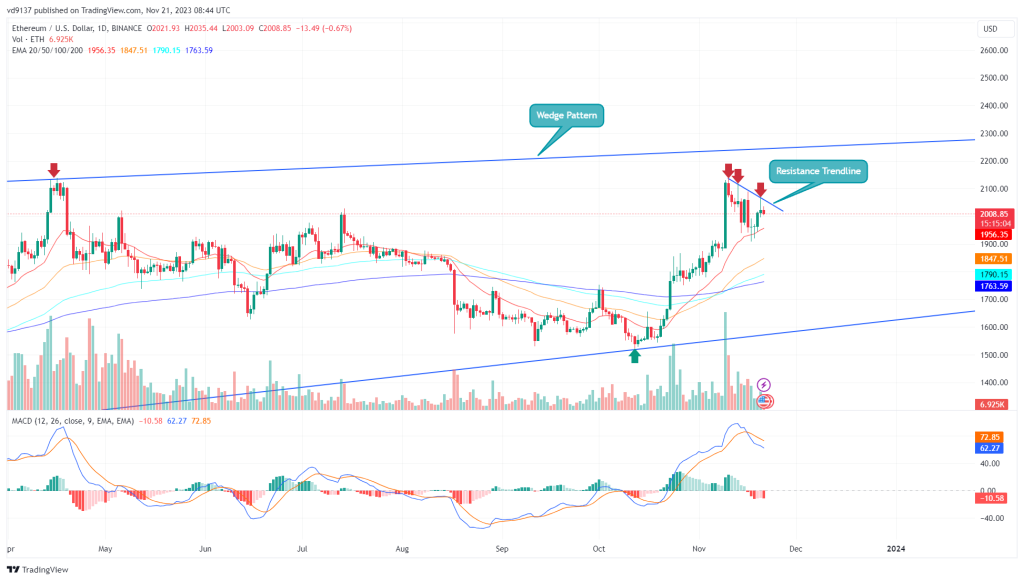
The ongoing correction in the Ethereum price can be followed using a downsloping resistance trendline of the 4-hour time frame chart. The coin price reverted several times from the overhead trendline reflecting the market sentiment of selling on a bullish bounce.
Until this trendline is intact, the ETH price may prolong its ongoing downward trend. However, as per the Fibonacci retracement tool, this pullback is still above the 50% retracement level, which is considered healthy for bullish momentum and carries a long-term recovery.
Thus, the market participants bullish on Ethereum should wait for a breakout above the resistance trendline to get better confirmation of trend continuation. The post breakout would surge the prices 12% higher to hit the upper resistant trendline of the long-coming wedge pattern around $2200-$2500.
Technical indicators:
MACD indicator: A bearish crossover between the MACD and signal lines projects as a correction trend in action.
EMA: the 20-day EMA slope is offering strong pullback support to the ETH price
Is ETH Price Ready to Hit $2500?
A look at the Daily time frame Chart shows the Ethereum price has been carrying a steady uptrend under the influence of a rising wedge pattern. As the anticipated rate is likely to reach the upper resistance of the pattern, the coin price may witness an intense surge in selling pressure around the $2250 mark.
The historical data shows a retest to the upper trendline has often resulted in a significant correction within the wedge pattern. Thus, for better confirmation of a bullish trend, the buyers must surpass this overhead trendline.
Under ideal conditions, the wedge pattern breakout could lead the ETH price rally to $3400.
0
0


 Manage all your crypto, NFT and DeFi from one place
Securely connect the portfolio you’re using to start.
 Where will Bitcoin trade next?
Live Polymarket and Kalshi odds on Bitcoin price targets, compared side by side.
See Bitcoin price odds


