
Bitcoin, Ethereum, XRP Crash: Will Prices Recover After US Midterms?

0
0

The crypto market is trading near $2.58 trillion, down 1% in 24 hours. Traders are nervous before the US midterms, and the fallout from the Binance hack is still weighing on mood.
Bitcoin slipped about 1% to around $77,000. Ethereum lost 0.56% but held $2,250. XRP is fighting to keep $1.25.
Fear Index Sinks to 26 as $340M in Longs Get Wiped Out
The Crypto Fear & Greed Index now reads 26, which is Fear. It was 37 yesterday and 48 last week, a Neutral reading. Last month it stood at 65, or Greed.
Leverage took the hit. Liquidations reached $386.42 million in 24 hours, and 94,909 traders were wiped out. Longs made up 88.2%, or $340.74 million. Shorts were 11.8%, or $45.68 million.
The pain was not even across the clock. Over the past 12 hours, longs lost $66.34 million. In the last hour and the last four hours, shorts took more of the hit.
Period | Total Liquidated | Longs | Shorts |
1 hour | $5.78M | $540.06K | $5.24M |
4 hours | $19.21M | $8.33M | $10.88M |
12 hours | $85.16M | $66.34M | $18.82M |
24 hours | $386.42M | $340.74M | $45.68M |
Binance accounted for 49.3% of the liquidations. The largest single order was an $8.78 million BTCUSDT long on Binance at $76,599.68.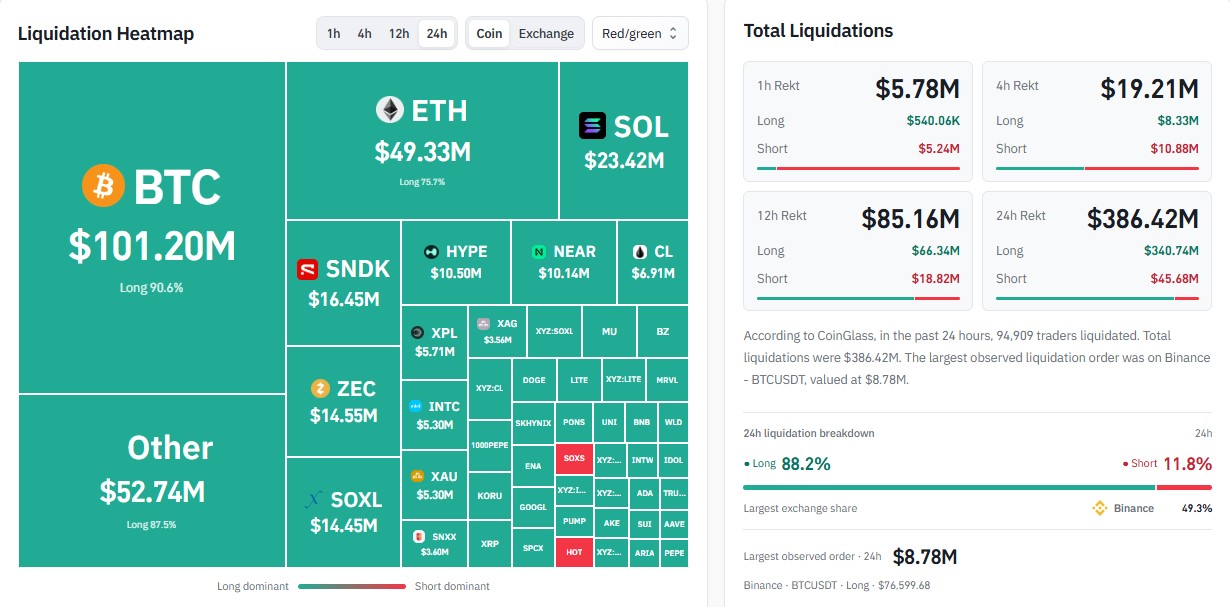
Which Coins Took the Biggest Hit
Asset | 24H Liquidations | Long Share |
Bitcoin (BTC) | $101.20M | 90.6% |
Ethereum (ETH) | $49.33M | 75.7% |
Solana (SOL) | $23.42M | n/a |
SNDK | $16.45M | n/a |
ZEC | $14.55M | n/a |
SOXL | $14.45M | n/a |
HYPE | $10.50M | n/a |
NEAR | $10.14M | n/a |
Other coins | $52.74M | 87.5% |
Bitcoin alone made up about a quarter of the total. SNDK, ZEC, and SOXL also saw big liquidations, which shows the stress went well beyond the top coins.
ETF Outflows Hit Bitcoin and Ethereum, XRP Holds Up
Asset | 1-Day Flow | 30-Day Flow |
BTC | -$398.62M | -$1.21B |
ETH | -$139.80M | -$1.65B |
XRP | -$529.51K | +$17.52M |
Data as of Nov. 2.
Asset | Cumulative Net Inflow | Net Assets | ETF % of Market Cap | Value Traded |
BTC | $56.60B | $98.12B | 6.33% | $1.99B |
ETH | $12.15B | $13.18B | 4.75% | $577.77M |
XRP | $1.81B | $1.42B | 1.79% | $18.26M |
Bitcoin's market cap sits at $1.55 trillion. Ethereum's is $277.63 billion, and XRP's is $79.59 billion.
Short-term demand from big money looks softer for BTC and ETH. XRP funds still show small inflows over 30 days, though the one-day flow was slightly negative.
Bitcoin Eyes $75,000 Dip-Buy Zone After $79,000 Rejection
Analyst Michaël van de Poppe sees $75,000 as an "obvious long" zone. He points to a clear rejection at $79,000 that pushed price back toward the lows. He also thinks the US midterms could mark a low in a "sell the rumor, buy the news" move.
If selling speeds up after the Binance hack and the election, $73,000 is the next level to watch. That is near the short-term holder cost basis.
Level | Why It Matters |
$79,000 | Clear rejection, key resistance |
$77,600 | Area tested late Sunday |
$76,600 | Current trading zone |
$75,000 | Dip-buy zone flagged by van de Poppe |
$73,000 | Short-term holder cost basis |
A bounce above $77,600 would ease some pressure. A break below $75,000 would put $73,000 in focus.
The setup can flip fast, so traders should watch the weekly close.
Ethereum Nears Key Decision Zone Around $2,287
One trader says ETH, near $2,287, is approaching a major higher-timeframe decision zone. He sees current levels as a decent entry.
His ideal accumulation zone is $1,800 to $1,900. That is where a bullish order block meets a fair value gap. He wants a liquidity sweep and bullish confirmation first.
If that plan works, his long-term targets are $2,700, $3,200, $4,400, $6,000, and $10,000.
These are one trader's views, not forecasts. ETH could move either way.
XRP Squeeze Hints at Big Move Near $1.25
XRP trades at $1.2527, down 0.68% in 24 hours. Market cap is $79.01 billion, with 63.35 billion coins in circulation. Spot volume is $360.48 million.
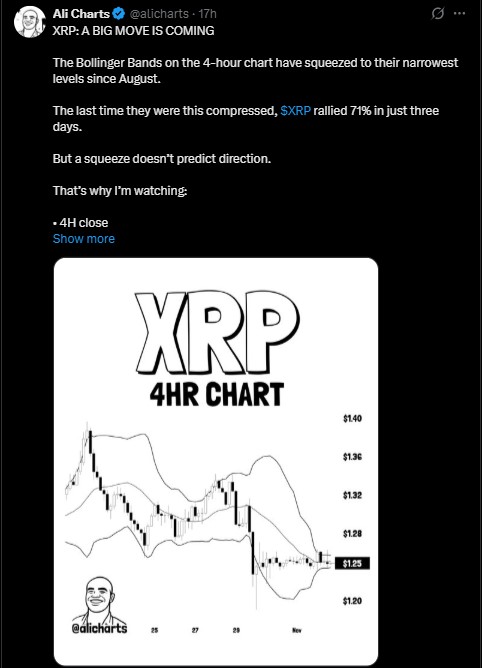
Price has moved sideways for three days after a sharp drop last week. The 4-hour Bollinger Bands have squeezed to their narrowest level since August. The last time that happened, the token jumped 71% in just three days.
A squeeze does not show direction, though. It only says a bigger move may be close.
Analyst Ali Charts shared the 4-hour chart with the tight bands. A close above $1.27 is bullish for him, and a close below $1.23 is bearish.
Level | Price | What It Means |
Bullish trigger | 4H close above $1.27 | Buyers may gain control |
Bearish trigger | 4H close below $1.23 | Sellers may take over |
No-trade zone | $1.23 to $1.27 | Price is stuck in a range |
First recovery test | $1.28 to $1.30 | Early sign of a bounce |
Stronger resistance | $1.33 to $1.36 | Heavy supply area |
Major overhead level | $1.50 | Dashed line on the daily chart |
Support zone | $1.24 to $1.22 | Break could open at $1.20 and $1.15 |
Daily Chart Still Leans Bearish
On the daily chart, XRP has broken below its descending channel support. It now trades under all four major moving averages.
Indicator | Value |
20 EMA | $1.3006 |
50 EMA | $1.3366 |
100 EMA | $1.3243 |
200 EMA | $1.3637 |
RSI (14) | 37.45 |
RSI average | 39.87 |
The RSI sits below its own average, so momentum still favors sellers. Still, the last three candles are small. That hints at a pause, and a short relief bounce is possible.
If $1.24 to $1.22 fails, the next stops are $1.20 and then $1.15. A daily breakout above $1.28 to $1.30 would be the first real sign of recovery. The $1.50 level is far above for now.
Where Crypto Could Go Next
The next move likely depends on the election result, ETF flows, and the Fed. Nothing is certain here.
If buyers defend $75,000 for Bitcoin and $1.22 for XRP, a recovery after the US midterms is possible. If not, deeper dips are on the table.
Disclaimer
This article is for information only and is not financial advice. Crypto is volatile, and you can lose money. Do your own research before trading.
0
0


 Manage all your crypto, NFT and DeFi from one place
Securely connect the portfolio you’re using to start.
 Where will Bitcoin trade next?
Live Polymarket and Kalshi odds on Bitcoin price targets, compared side by side.
See Bitcoin price odds


