Forecasting MATIC's fortunes for the upcoming week
1
0

Disclaimer: The findings of the following analysis are the sole opinions of the writer and should not be considered investment advice
MATIC’s decline below the $0.94-level manoeuvred the near-term trend in favor of sellers
The crypto’s social dominance and network growth took a plunge.
The recent selling efforts pulled Polygon [MATIC] back into its bearish track as it witnessed a solid bearish rebuttal from the $1.2-resistance.
Read MATIC's Price Prediction 2023-24
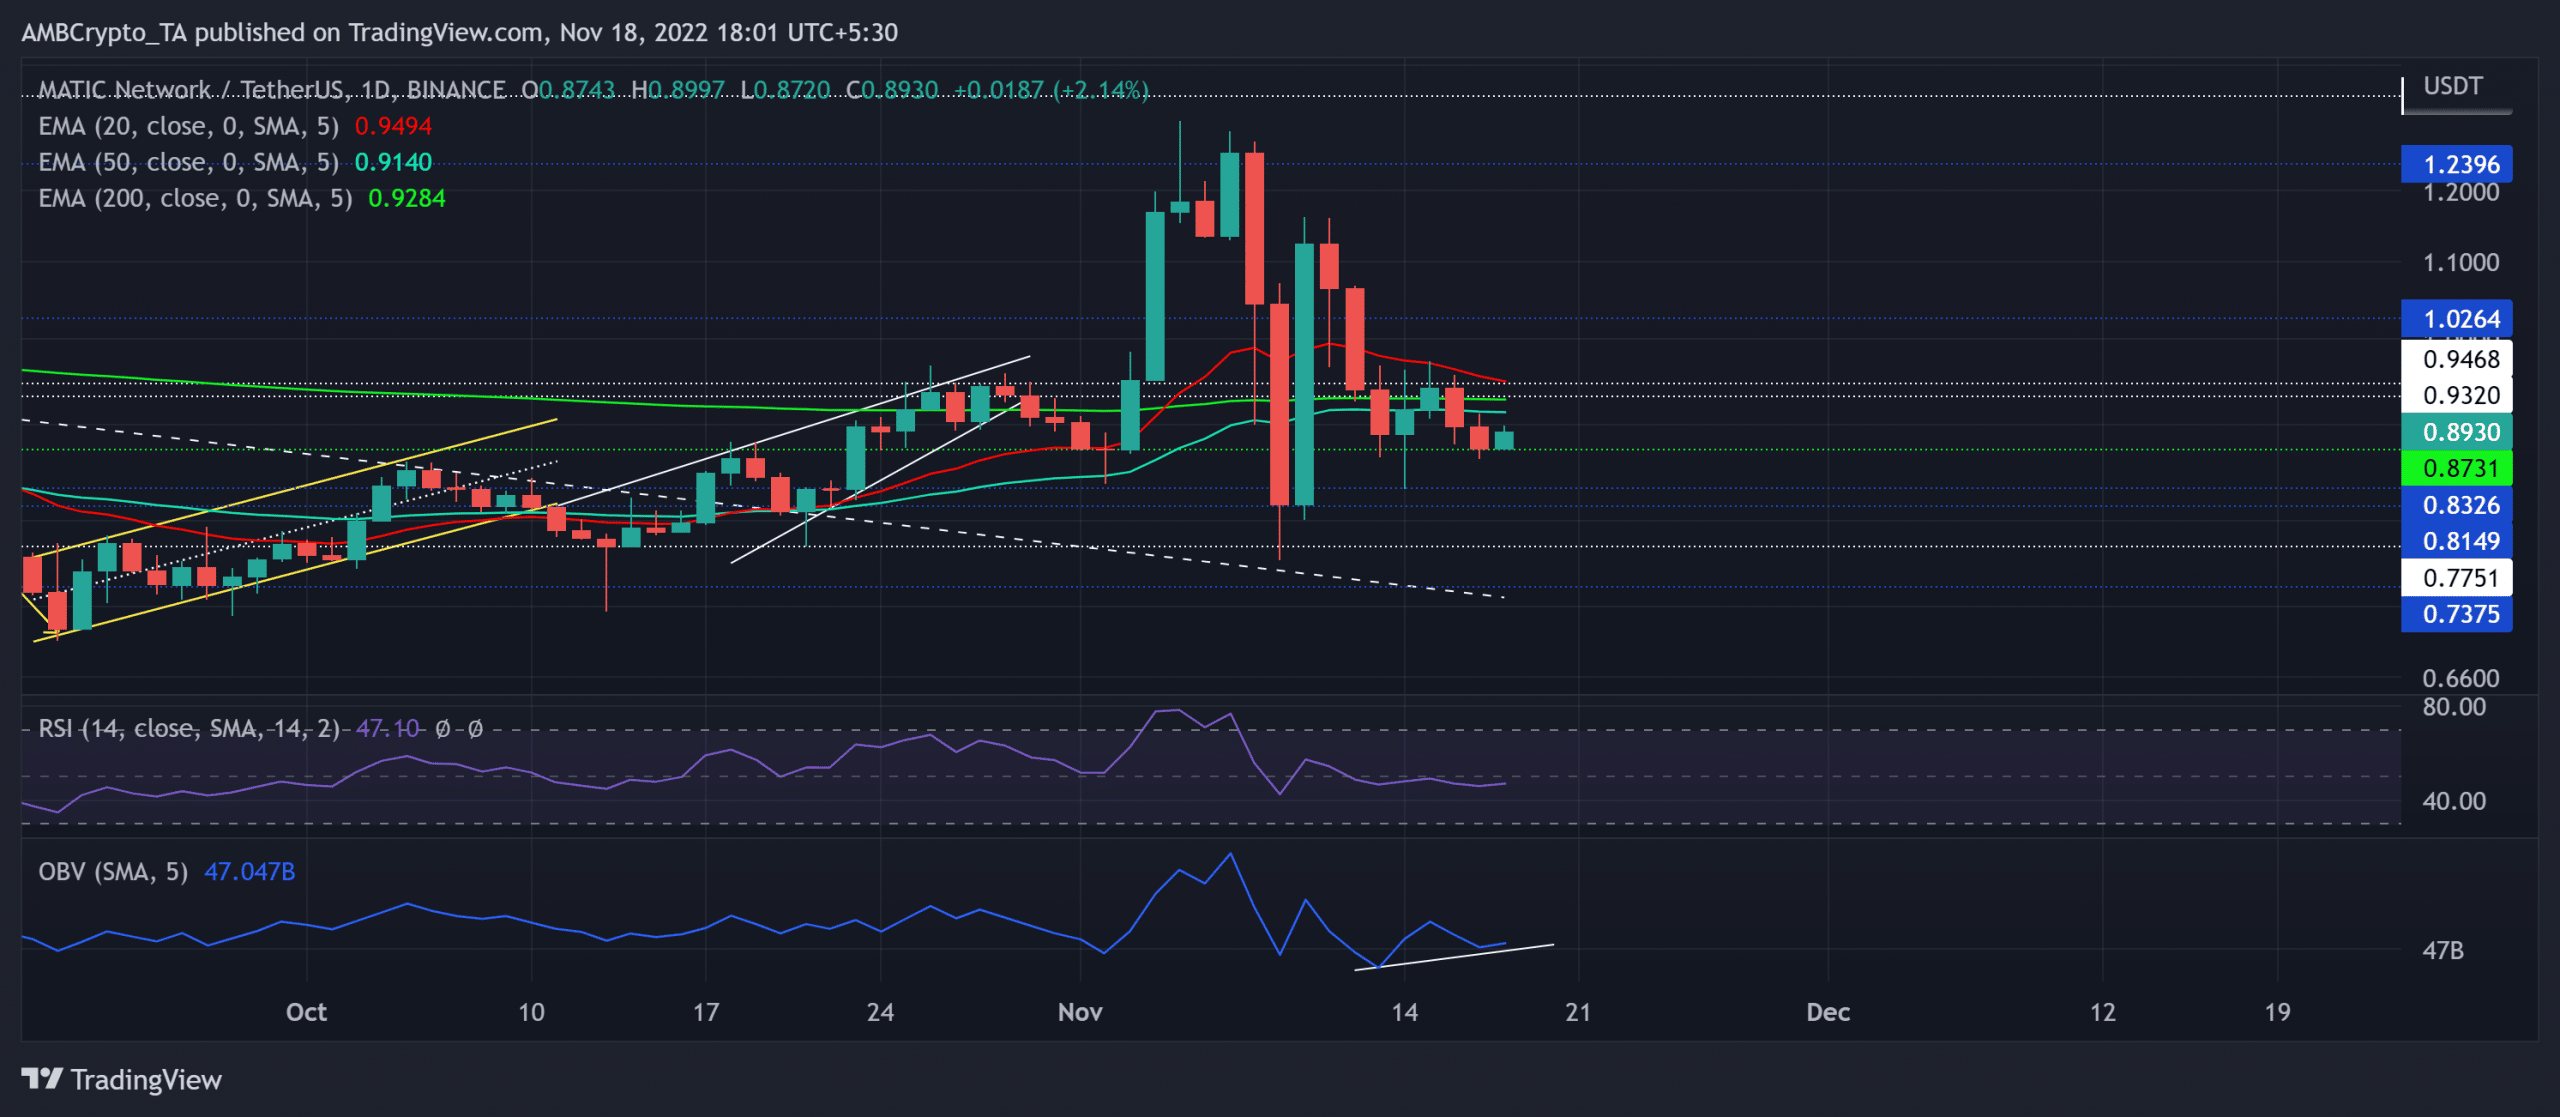
After slightly slowing down at the $0.87 support level, MATIC constricted its high volatility over the last few days. The sellers could aim to reclaim their edge in case of a bearish crossover in the near-term EMAs.
At press time, MATIC was trading at $0.893, up by 1.37% in the last 24 hours.
MATIC consolidated near its EMAs
Source: TtradingView, MTAIC/USDT
Since breaking above the vital trendline support (white, dashed), MATIC has propelled numerous bull runs toward the $1.2-ceiling. The bearish engulfing candlestick on 8 November bolstered the selling pressure and pulled the coin below its 20/50/200 EMA.
In the meantime, MATIC lost a third of its value as it tested the $0.81-support last week. With the 20 EMA (red) looking south, a plausible death cross with the 200/50 EMA can delay MATIC's near-term revival prospects.
Any reversal from the $0.93-$0.94 resistance range could extend the slow-moving phase in the coming sessions. A breach of the $0.87-support could propel a pulldown toward the $0.77-$0.8 range.
A potential/ immediate recovery from this support range could present buying opportunities. The first major resistance level would continue to be in the $0.94-zone. Any close above this barrier could inflict impressive gains while pushing MATIC above the $1 region.
The Relative Strength Index (RSI) stood near the equilibrium to project a rather neutral position. The buyers should look for a reliable close above or below the zero mark to gauge broader momentum.
Nonetheless, the On-Balance-Volume's (OBV) higher troughs over the last five days bullishly diverged with the price action.
A decline in Network growth and Social Dominance
As per Santiment's data, MATIC's network growth registered a sharp drop from its mid-October peak. On the other hand, the price action gradually grew during the same time.
To top this off, the alt's social dominance also marked a corresponding dip over the last two weeks. These readings highlighted a bearish edge for the token, but the targets would remain the same as discussed.
Finally, investors/traders must keep a close eye on Bitcoin’s movement as MATIC shares a nearly 30% 30-day correlation with the king coin.
The post Forecasting MATIC's fortunes for the upcoming week appeared first on AMBCrypto.
1
0


 Manage all your crypto, NFT and DeFi from one place
Securely connect the portfolio you’re using to start.
 Where will Bitcoin trade next?
Live Polymarket and Kalshi odds on Bitcoin price targets, compared side by side.
See Bitcoin price odds