
Bitcoin (BTC) Price To Hit This Bottom Level, If 2018 Bearish Cycle Repeats
1
3

The post Bitcoin (BTC) Price To Hit This Bottom Level, If 2018 Bearish Cycle Repeats appeared first on Coinpedia Fintech News
The entire crypto market has witnessed a sharp fall following unexpected events which caused catastrophic waves across the industry. Bitcoin has dropped below its two-year low of $18K and continues to remain in an uncertain price range.
Moreover, concerns regarding inflation and the results of the midterm elections have brought a mixed situation for the market’s future movement.
As Bitcoin investors dump their BTC holdings and exit the market amid an alarming trend, BTC continues to trade in a crucial price range to test long-term holders’ patience.
A Bitcoin Price Bottom Is Nearby!
The lack of concept and clarity about proof-of-reserves have become one of the main reasons in driving the recent collapse of FTX, which is responsible for vanishing a significant amount of BTC from its circulation.
According to a well-known crypto trader, DonAlt, the current rate of Bitcoin’s bearish trend makes a similarity to its previous bearish cycles.
The analyst analyzes that Bitcoin is currently almost 80% down compared to its 2014-2015 and 2017-2018’s bearish cycles, where the downward rates were 86.17% and 83.84%, respectively.

If Bitcoin follows its bearish trend of 2017-2018 and extends its rate of downtrend above 84%, then the BTC price can witness a bottom level at $11K.
Moreover, DonAlt further predicts that BTC may fall to $9.5K if it follows the bearish trails of the 2014-2015 cycle and increases its rate of downtrend above 87%.
A Breakout Above This Level May Spark Surges For BTC Price
Bitcoin is struggling to bring bullish hopes to its long-term holders as it faces hurdles in surpassing its resistance level at $17K.
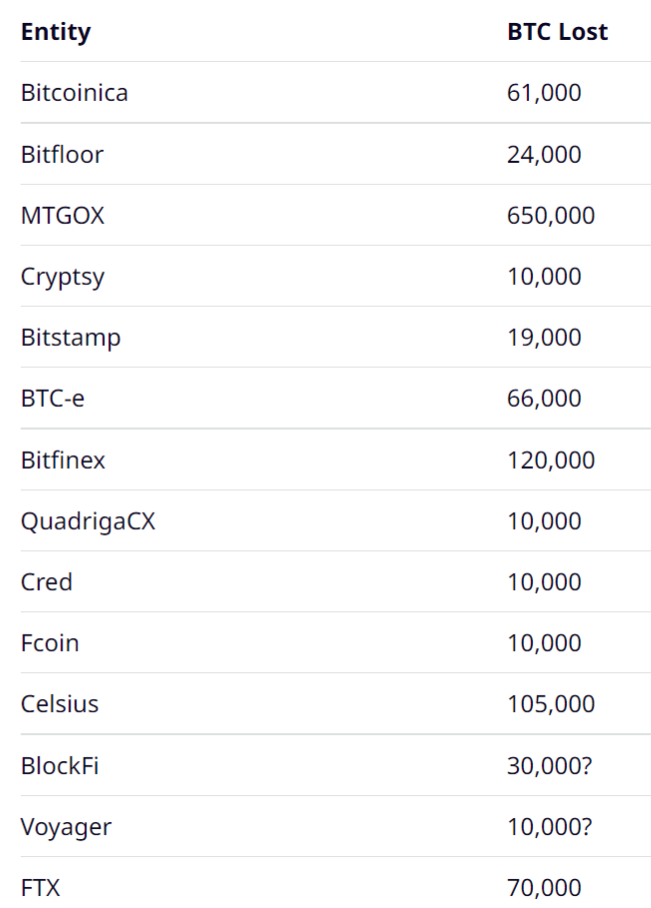
Historical data of crypto crashes reveals that 14 exchanges were responsible for wiping 1,195,000 BTC from its circulation, which has created a scarcity in framing a stable bullish infrastructure for pushing Bitcoin’s price upward.
However, amid all these situations, investors are still accumulating Bitcoin, even in FUD, with a hope for a bullish breakout soon. Moreover, El Salvador’s president Nayib Bukele has announced plans to buy 1 BTC daily starting from 17 November.
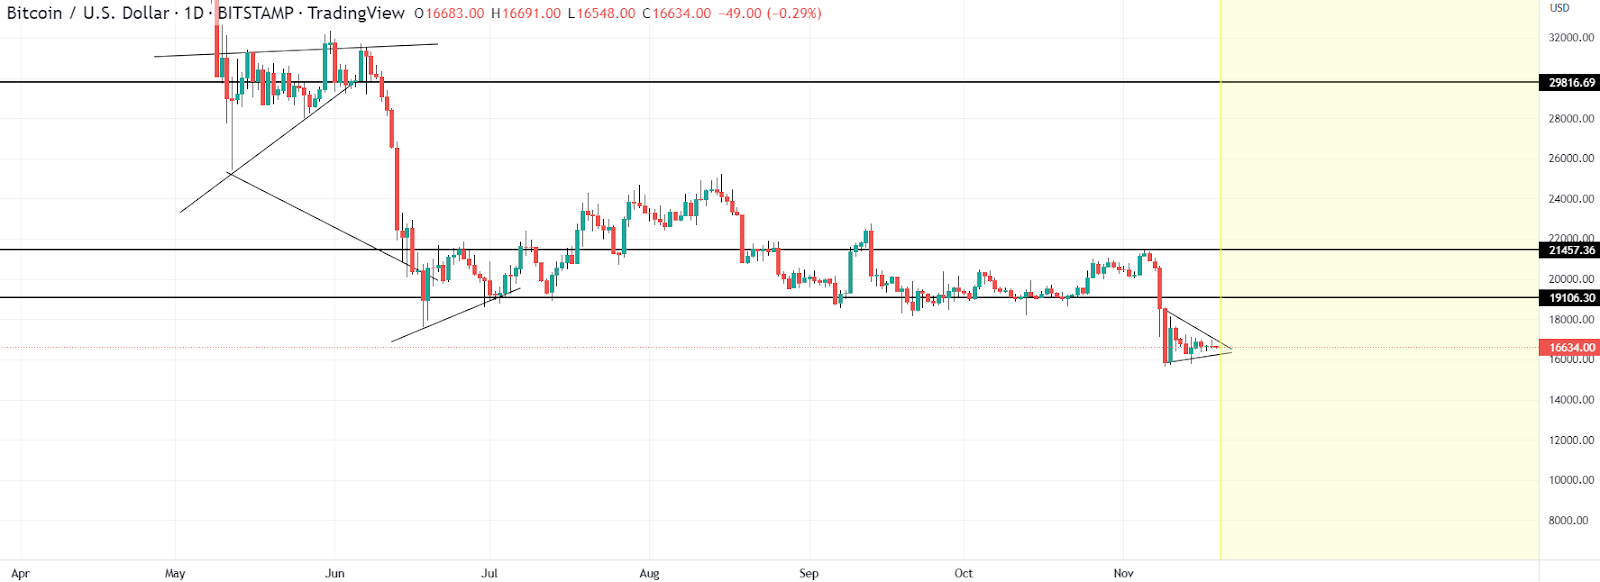
Bitcoin trades at $16,662, with a downtrend of 0.27% from yesterday’s price. Looking at the daily price chart, SMA-14 is significantly dropping, and it is trading at 38-level, just above the RSI trend line, forcing Bitcoin to test its support level at $16,350.
Moreover, Bitcoin’s Net Unrealized Profit/Losses metric has seen massive volatility as it drops to its bottom zone.
However, the NUPL’s trend indicates a final capitulation, from which BTC price may initiate a bullish recovery, as witnessed in its previous bearish cycles.
A sustainable price movement above $17K may trigger the buying pressure, which can lift the RSI indicator above the 50-level. If BTC’s price holds its momentum between the EMA-20 and EMA-50 trend lines, it can aim for a breakout above its strong resistance at $20K.
1
3


 Manage all your crypto, NFT and DeFi from one place
Securely connect the portfolio you’re using to start.
 Where will Bitcoin trade next?
Live Polymarket and Kalshi odds on Bitcoin price targets, compared side by side.
See Bitcoin price odds


