
Bitcoin price at $73,700: what to watch after eight days of IBIT outflows

0
0
Bitcoin costs around $73,700, or roughly €66,500, on Thursday morning, November 12, 2026. Our price page shows the current bitcoin price with a chart. One figure in particular is new since early yesterday: on Tuesday, only $95 million flowed out of US bitcoin ETFs, after $430 million a week earlier. The outflow is getting smaller, but it has not stopped. BlackRock's largest bitcoin fund is losing money for the eighth trading day in a row, and on Friday US producer prices bring the next inflation test before the Federal Reserve decides on interest rates on December 9.
According to CoinGecko, the price moved between $73,381 and $74,648 over the past 24 hours, almost unchanged on balance. In euros there is a small gain of just under 0.8 percent because the dollar weakened slightly. For investors in the euro area, both matter: the price levels are traded in dollars, while your portfolio is valued in euros.
Bitcoin price on Thursday morning: $73,700, just under $575 above the 200-day line
The 200-day line is the average of daily closing prices over the past 200 days; many funds read it as the boundary between an intact and a damaged trend. By our calculation from CoinGecko's daily data, it stands at $73,125 on Thursday morning. Bitcoin is thus trading only a little more than 0.8 percent above it, as narrowly as on Wednesday.
The shorter averages are all higher. The 20-day average is at $77,740, the 50-day average at $81,141 and the 100-day average at $77,632. Anyone who bought in October is therefore, on average, sitting on a loss. Since Tuesday morning, the range according to CoinGecko's hourly data stretched from $72,840, reached on Tuesday evening after the inflation data, to $75,267 before their release.
Bitcoin ETF outflows shrink: $95 million on Tuesday after $430 million
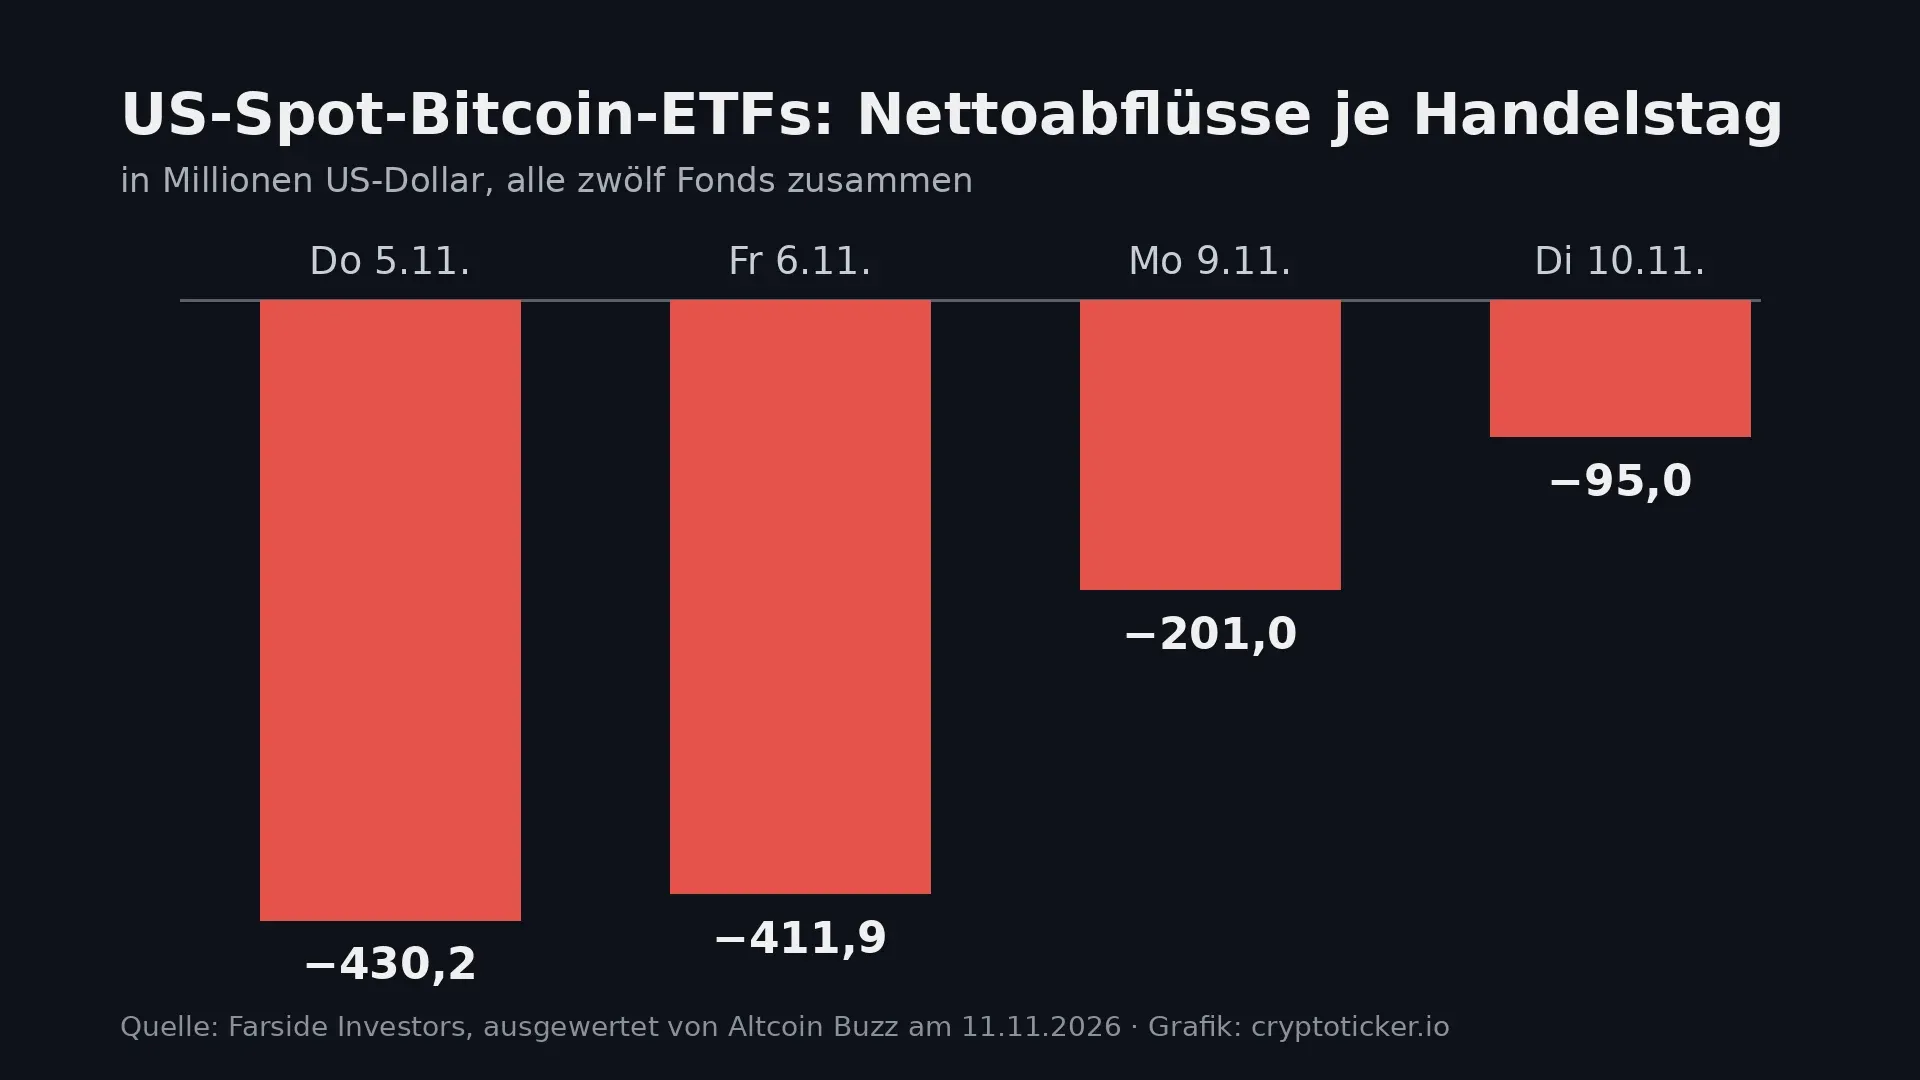
A spot bitcoin ETF is an exchange-traded fund in the US that buys and holds actual bitcoin; when money flows out, the provider usually has to sell or hand over coins. Exactly this selling pressure has weighed on the price since the start of November. According to the flow table from Farside Investors, analysed by Altcoin Buzz, the twelve US funds together lost $430.2 million on Thursday, November 5, $411.9 million on Friday, $201.0 million on Monday and $95.0 million on Tuesday.
That is the fourth day of outflows in a row, but the amounts are almost halving from session to session. Only one fund was in positive territory on Tuesday: Morgan Stanley's bitcoin fund (MSBT) took in around $20 million, too little to offset the redemptions elsewhere. Since the start of the month, outflows from all US bitcoin funds add up to around $1.6 billion, according to the same analysis. Figures for Wednesday were not yet complete early on Thursday morning, European time.
BlackRock's IBIT loses money for an eighth straight trading day: $1.73 billion since October 30
Most of the redemptions are still coming from BlackRock's iShares Bitcoin Trust, IBIT for short. According to Farside, the fund shed $78.2 million on Tuesday, more than four fifths of the total daily outflow. It was the eighth straight session of outflows, together around $1.73 billion since October 30, Altcoin Buzz writes, citing the reported flow data.
Where the money is going is shown by an observation from Bloomberg ETF analyst Eric Balchunas, quoted by Altcoin Buzz: in the same five sessions, around $12 billion a day flowed into US-listed funds, and all 17 funds with the highest inflows held equities. So the money is not leaving the market; it is switching asset class. For bitcoin, that is the more uncomfortable news, because it points to a decision against crypto risk rather than general cash hoarding.
US inflation in October: consumer prices up 0.4 percent, core rate up 0.3 percent
The background to the restraint comes from Tuesday's consumer prices. According to the market overview from Nexo of November 11, US prices rose 0.4 percent month on month in October and the core rate 0.3 percent, one tenth of a point above expectations. The core rate excludes energy and food because they fluctuate strongly; the central bank pays particular attention to it.
Several central bankers reacted clearly. Fed Governor Christopher Waller said, according to the same overview, that a half-point hike in December should be considered if core inflation is at around 0.3 percent or above. The president of the Dallas Fed, Lorie Logan, considers at least two further quarter-point moves necessary. The yield on ten-year US Treasuries stood at 5.01 percent in Asian trading on Wednesday.
Fed rate decision on December 9: a quarter point is the base case, half a point just under 15 percent
The Fed's next rate decision is due on December 9, the first of 2027 on January 27. In the futures market, a quarter-point hike is the base case; according to Nexo, the CME FedWatch tool priced a half point at just under 15 percent on Wednesday. Rising rates make safe investments such as government bonds more attractive and make credit for leveraged purchases more expensive. Bitcoin, which pays no interest itself, often loses demand in such phases.
For the price, this means every new inflation figure shifts the odds between a quarter and a half point. Half a point would be a much harsher signal than priced in, while a quarter point without further guidance could take pressure off the market.

US producer prices on Friday: the second inflation test after consumer prices
On Friday, November 13, the US Department of Labor publishes producer prices for October. Producer prices measure what companies charge for their goods and services before these reach the consumer; they are regarded as a leading indicator for inflation in the following months. Nexo explicitly calls the figure the second inflation test after consumer prices and, alongside a return of ETF inflows, the signal to watch for bitcoin.
The bar is high. In September, producer prices had risen 6.3 percent year on year, the strongest increase since December 2022, as we reported on October 15 after the Department of Labor's release. If the October figure comes in high again, many traders expect the debate about a half-point move in December to grow louder. A softer figure, on the other hand, would ease the situation for bitcoin and equities.
AI stocks pick up: bitcoin has so far not joined the recovery
Equity markets looked friendlier on Wednesday. According to Nexo, Nvidia rose around 5 percent in pre-market trading, and cloud provider CoreWeave reported a 168 percent rise in third-quarter revenue and raised its annual guidance to $13 billion to $13.3 billion. Europe's STOXX 600 was close to its record.
Bitcoin has not joined this recovery so far. The total market capitalisation of all cryptocurrencies was around $2.4 trillion, according to Nexo. The ETF data show something similar: the capital returning to the stock market is currently landing in equity funds, not in bitcoin funds.
Fear and Greed Index falls to 28: third day in a row in fear territory
The Fear and Greed Index from alternative.me combines volatility, trading volume, social media sentiment and other data into a number between 0 (extreme fear) and 100 (extreme greed). On Thursday it stands at 28, after 29 on Wednesday and 32 on Tuesday. That is fear, but not yet extreme fear, which starts below 25. On its own, such a reading does not predict a turnaround; it only shows that few market participants dare to stand on the buy side.
Bitcoin levels before Friday: $72,840 below, $74,650 above
CoinGecko's data point to three zones. Below lies the 200-day line at $73,125, and beneath it the low after the inflation data at $72,840. If the price falls below that level, the data of recent weeks show hardly any zone down to the round $70,000 mark where meaningful buying took place lately. Above, the 24-hour high at around $74,650 caps the price, followed by $75,000 and the pre-inflation-data level of $75,267. Only above the 20-day average at $77,740 would the short-term downtrend be broken.
The levels are no guarantee. These zones show where many traders place their orders, and therefore where the price may be decided after the producer prices.
Buying bitcoin in Europe: bitcoin ETPs or MiCA exchanges instead of US ETFs
As a rule, US funds such as IBIT cannot be bought by retail investors in the EU because they lack the key information document required under EU law. Anyone wanting to invest in bitcoin via the stock exchange therefore turns to bitcoin ETPs, securities traded on European exchanges and usually backed by actual bitcoin. Which products exist and what matters on costs and collateral is explained in our crypto ETF guide.
The direct route runs through a crypto exchange or broker authorised under the EU's MiCA regulation. Among other things, this licence requires client funds to be held separately from the provider's own assets. Which providers are MiCA-authorised and what they cost is shown in our comparison of the best crypto exchanges. If you prefer to hold bitcoin alongside shares and ETFs in the same account, you will find suitable providers in the crypto broker comparison.
Leverage and liquidation before producer prices: how little room a futures trade has
A liquidation is the forced closure of a leveraged position as soon as the posted collateral no longer covers the losses. With tenfold leverage, a counter-move of around ten percent is enough, slightly less depending on the exchange and fees. A long at $73,700 would thus already be gone at around $66,300, a short on a jump above $81,000. With fivefold leverage, the limit is around 20 percent.
Especially ahead of a data release such as producer prices, the price often jumps in both directions within minutes. If you trade with leverage, set a stop level and work out the distance to liquidation in advance, rather than relying on the levels from the previous section.
Our view: ETF outflows are easing, but a buyer is still missing
Our opinion: the shrinking outflows are the first friendly signal in a week. But as long as IBIT loses money every day and new capital flows into equity funds, the price lacks the buyer that would carry it above $75,000. Friday's producer prices will help decide whether the debate about a half point in December grows louder or quieter. No reliable forecast can be derived from this.
Bitcoin before Friday: without ETF buyers, $75,000 remains the ceiling
- Decide at what price you want to buy or add to your position, and use a MiCA-authorised provider from our exchange comparison.
- If you buy via the stock exchange, consider whether a physically backed bitcoin ETP suits your portfolio; providers are listed in the broker comparison.
- Record the purchase date and purchase price of every position. Tax rules depend on where you live, and a complete record makes any later calculation easier.
(As of November 12, 2026. This article is not investment advice. Prices and fee structures change; check the terms with the provider before you buy.)
0
0

 Manage all your crypto, NFT and DeFi from one place
Securely connect the portfolio you’re using to start.
 Where will Bitcoin trade next?
Live Polymarket and Kalshi odds on Bitcoin price targets, compared side by side.
See Bitcoin price odds


