
CYBER Price Prediction After Wedge Breakout: Can Bulls Hold?

0
0

CYBER jumped roughly 40% in 24 hours and broke out of a falling wedge on the Binance 4H chart, with the 4H RSI reaching 83.68. Futures volume ran about four times spot volume, so the move looks derivatives-led and stretched. Traders should watch whether price holds the 100 EMA near $0.245 or stalls at the $0.342 resistance, and they can follow related AI crypto news for sector context.
CYBER Price Prediction: What Is Happening Now?
Current Price and 24H Performance
CyberConnect (CYBER) trades near $0.30. CoinGecko lists CYBER at $0.3017, up 43.6% in 24 hours, with a 24-hour range of $0.1999 to $0.3052.
The token still trades about 98% below its all-time high of $15.79 (CoinGecko), so this surge is a recovery from a deeply depressed base.
Trading Volume and Market Cap
CoinGecko reports a 24-hour trading volume of $24.568M against a market cap of $17.966M, with a fully diluted valuation of $29.417M. Circulating supply is 61.075M of a 100M maximum, and the token ranks 808th on CoinGecko. Volume above market cap is a sign of heavy speculative activity, which usually makes price moves faster in both directions.
Why Is CYBER Moving Today?
The supply-demand picture points instead to derivatives. Futures volume reached $104.11M, which is 4.0x spot volume, and open interest rose 157.6% to $17.94M.
Shorts made up about 66% of the roughly $500K in 24-hour liquidations, so forced short covering likely added fuel. Fear & Greed sits at 11 (Extreme Fear), so this is a token-specific burst rather than a broad risk-on rally.
CYBER Technical Analysis: From Compression to Breakout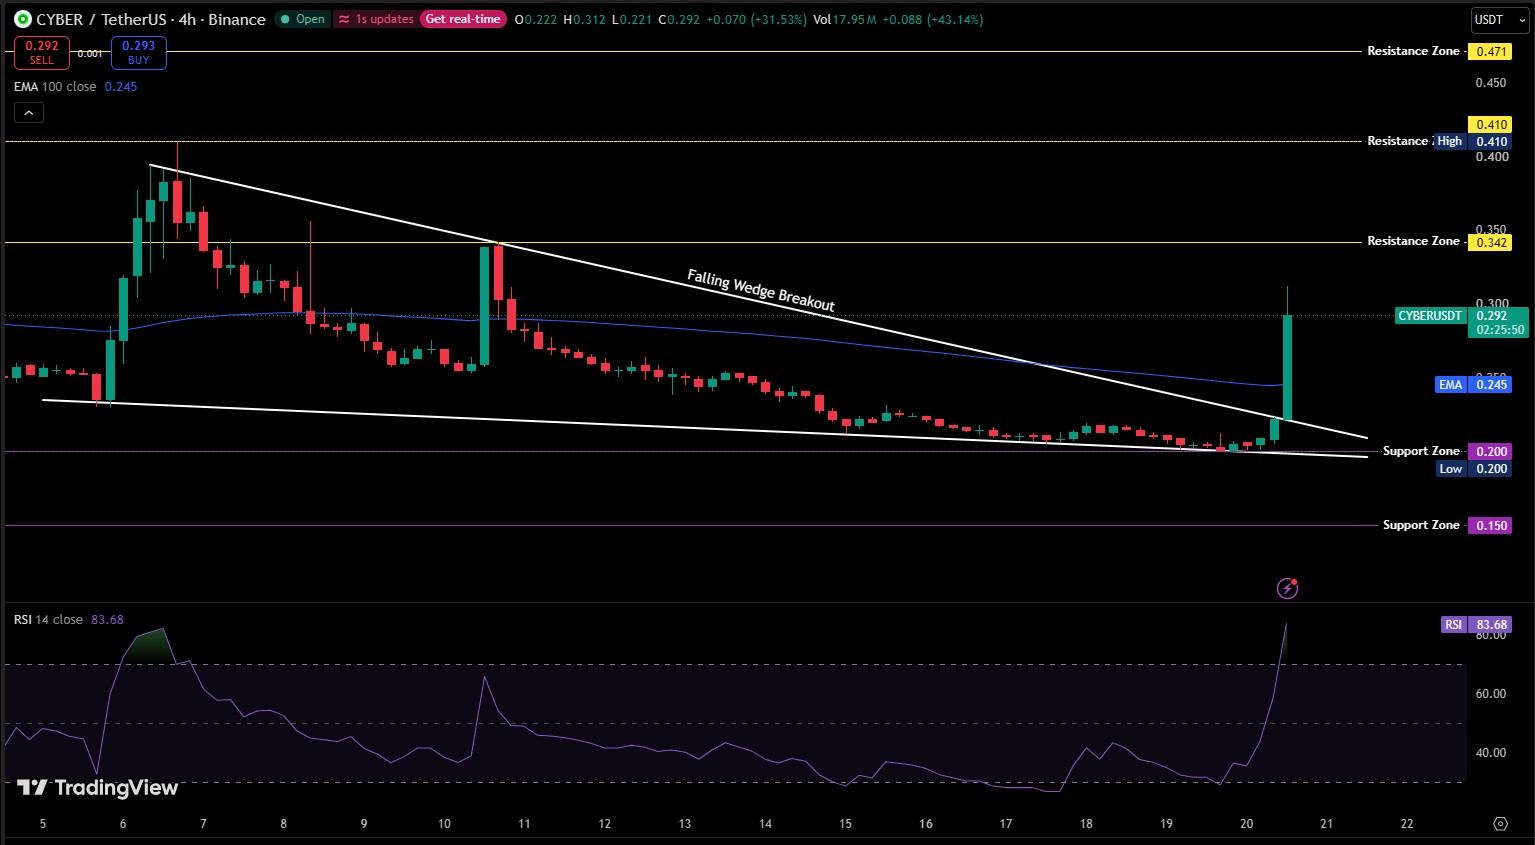
For several sessions, CYBER drifted lower inside a falling wedge. Each bounce was weaker, candles shrank, and the price pressed against the $0.200 support zone, which is also close to the all-time low of $0.1999. A falling wedge shows sellers losing force as the range narrows, and breakouts from it can lead to reversals, though they can also fail.
Then one large 4H candle (+31.53% on Binance, volume 17.95M) cleared the upper wedge line and the 100 EMA at $0.245 in a single move. The price below it signals a weak trend, and a close back above it can mark a shift in control. Price now sits well above it, which is constructive, but the distance itself shows how stretched the move is.
RSI (14) on the 4H chart is 83.68. Readings above 70 are considered overbought. That reflects strong momentum, and it also raises the risk of a pullback or sideways cooling. It does not mean the price must fall. So this analysis relies on RSI, the EMA, and price structure.
Key Support Levels
$0.245: the 100 EMA and the area where the breakout candle began. This is the first hold-or-fail zone.
$0.200: the wedge and range are low, close to the all-time low.
$0.150: the next marked support if $0.200 breaks.
Key Resistance Levels
$0.312: the 4H high set during the surge.
$0.342: the first marked resistance, where an earlier rally was rejected.
$0.410: the prior swing high.
$0.471: the upper resistance zone on the chart.
Spot vs Futures: Who Is Driving the CYBER Rally?
Short Liquidations and Open Interest
Open interest of $17.94M is nearly the same size as the $17.97M market cap (a cross-source comparison from CoinGlass and CoinGecko that should be verified before publishing). That means leveraged positioning is large relative to the token's size.
Binance holds about $7.65M of that open interest, followed by Bybit at 3.55M. Spot net flow was -1.8M on CoinGlass, so spot buyers did not clearly lead the move.
Why the Funding Rate Matters
CoinGlass futures data shows a funding rate of -3.4471% (about -3774% annualized), and Binance's perp basis is -3.93%. Negative funding means shorts pay longs, which reflects crowded bearish positioning that can feed squeezes.
Positioning is mixed, though: Binance accounts skew short (0.79 long/short ratio) while top-trader positions skew long (1.28). Because the funding figure is extreme, recheck it at publish time.
CYBER Supply Map: Vesting, Exchange Wallets, and Buyback
Vesting Schedule by Allocation
Total supply is fixed at 100M, and the official distribution table shows how much still vests:
Allocation | Share | Release schedule |
Ecosystem development | 34% | Split across partners, developers, integrations, and marketing, mostly vesting over 3 to 4 years |
Private sale | 25.12% | Locked 12 months after TGE, then 3-year linear quarterly vesting |
Team and advisors | 15% | Locked 15 months after TGE, then 3-year linear quarterly vesting |
Community treasury | 10.88% | 10% at TGE, 90% monthly over 5 years |
Community rewards | 9% | 2.4% for Season 1, 6.6% for future seasons |
CoinList public sale | 3% | 25% at TGE, 75% monthly over 6 months |
Binance Launchpool | 3% | Fully unlocked at TGE |
Circulating supply is about 61M of 100M, so roughly 39M tokens could still enter circulation over time, which is a structural headwind for sustained rallies.
Holder Concentration and Exchange Wallets
Etherscan's holder data shows 7,164 holders, with the top 5 holding 52.81% and the top 10 holding 75.82% of supply. The largest address is labeled an Upbit deposit wallet at 14.31%, and two Binance cold wallets hold 8.00% and 3.22%.
Exchange-labeled balances are not necessarily sellers, since they often represent custody for many users, but they do mean a large share of supply sits where it can be traded quickly. Other large wallets are unlabeled, so their intent is unknown.
Can the CYBER Rally Continue?
Bullish Scenario
Under the bullish scenario, CYBER could test $0.342 and then $0.410 if it holds above $0.30 and closes above $0.342 on rising volume. Invalidation would be a 4H close below $0.245.
Key risk: squeeze exhaustion and profit-taking after a vertical move.
Base Scenario
The base scenario is cooling and consolidation between $0.245 and $0.342 over the coming days as RSI resets from overbought levels. This would depend on the 100 EMA acting as support. It breaks if the price closes above $0.342 or below $0.245.
Bearish Scenario
If the 100 EMA fails on a 4H close, CYBER may retest $0.200, and a loss there could expose $0.150. This would likely coincide with fading volume and short covering running out. It is invalidated by a reclaim of the $0.292 to $0.312 area.
What Could Change the Outlook?
A shift in funding from negative to neutral, a sharp drop in open interest, new verified project news, or changes in where tokens trade can all alter the picture. Traders tracking venue changes can follow exchange listing updates, though no new listing is confirmed in the data used here.
CYBER Price Prediction for November and December 2026
Bull Case
A daily close above $0.342 with sustained volume could open a move toward $0.410, with $0.471 as an extension zone. This would be a 7-day to 30-day scenario and requires a broader risk appetite to improve from extreme fear.
Base Case
Price may trade between $0.245 and $0.342 for most of the period as the market digests the surge. This range is a framework built from marked chart levels, not a forecast of certainty.
Bear Case
A break below $0.245 could send CYBER back to $0.200, with $0.150 as the deeper downside level.
Key Levels to Watch
Support
$0.245 (100 EMA), $0.200, and $0.150.
Resistance
$0.312, $0.342, $0.410, and $0.471.
Breakout Confirmation
A 4H or daily close above $0.342 with rising volume, without a sharp reversal in funding or open interest.
Breakdown Risk
A 4H close below $0.245 exposes $0.200, and a close below $0.200 exposes $0.150.
Risks That Could Change the CYBER Price Prediction
Overheated momentum: RSI at 83.68 raises the chance of a pullback.
Leverage: open interest is roughly the size of market cap, so liquidation cascades can run both ways.
Supply: about 39M tokens remain to vest, and holder concentration is high.
Market mood: Fear & Greed at 11 reflects weak broad sentiment and Bitcoin ETF outflows.
Final Takeaway
CYBER has broken out of a falling wedge, reclaimed its 100 EMA and jumped about 40%, but the move rests on futures activity rather than a verified catalyst. The $0.245 EMA and the $0.342 resistance are the levels that may decide whether this becomes a trend or a squeeze that fades, while vesting and concentrated holdings remain a longer-term weight. For more setups, browse the full crypto price predictions hub. Overall, this CYBER price prediction depends on whether $0.245 holds and $0.342 breaks.
Disclaimer: This article is for informational purposes only and is not financial or investment advice. Cryptocurrency prices are highly volatile, and the scenarios and price levels above are not guarantees or predictions of certainty.
0
0

 Manage all your crypto, NFT and DeFi from one place
Securely connect the portfolio you’re using to start.


