
SUI Price Prediction: BaseCamp Bull Run? Can SUI Hit $50 by Q4?

0
0

SUI is back in focus after two bullish X posts sparked fresh attention around its future upside. One post highlights a possible comeback toward $6, while another from Sui Intern makes a much more aggressive $50 by Q4 call.
Both are bullish views, but the TradingView chart shows that SUI Price Prediction still has several levels to clear before those targets become relevant.
SUI News: Why Are $6 and $50 Targets Trending?
Giannis Andreou's X post presents a bullish recovery setup for SUI. The post says that holding the 0.90-1.05 area and reclaiming 1.40-2.00 would strengthen the bullish scenario. It then points toward $3.50, the historical high near $5.35, and potentially $6.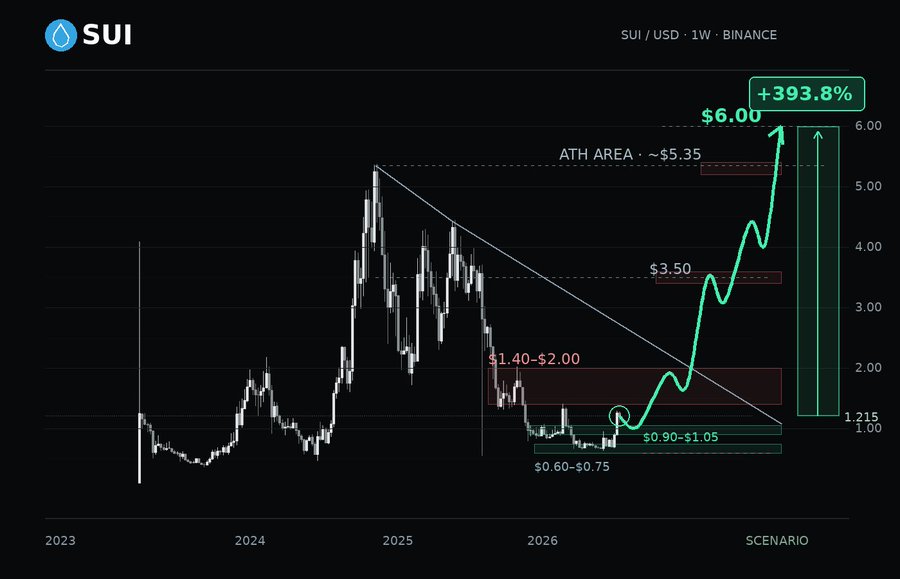
Source: Data From X
The same post highlights a final target of $6, describing it as roughly 394% above the chart price of $1.215 shown in that post.
A separate Sui Intern post takes an even more aggressive view, stating that $SUI could reach $50 by Q4 and calling the BaseCamp week super bullish.
These are X-post claims, not confirmed price targets. The current chart needs to be watched closely before drawing conclusions.
SUI Forecast: Technical Analysis
The latest TradingView 4-hour chart shows the SUI price today is trading at $1.1897, down 2.5%.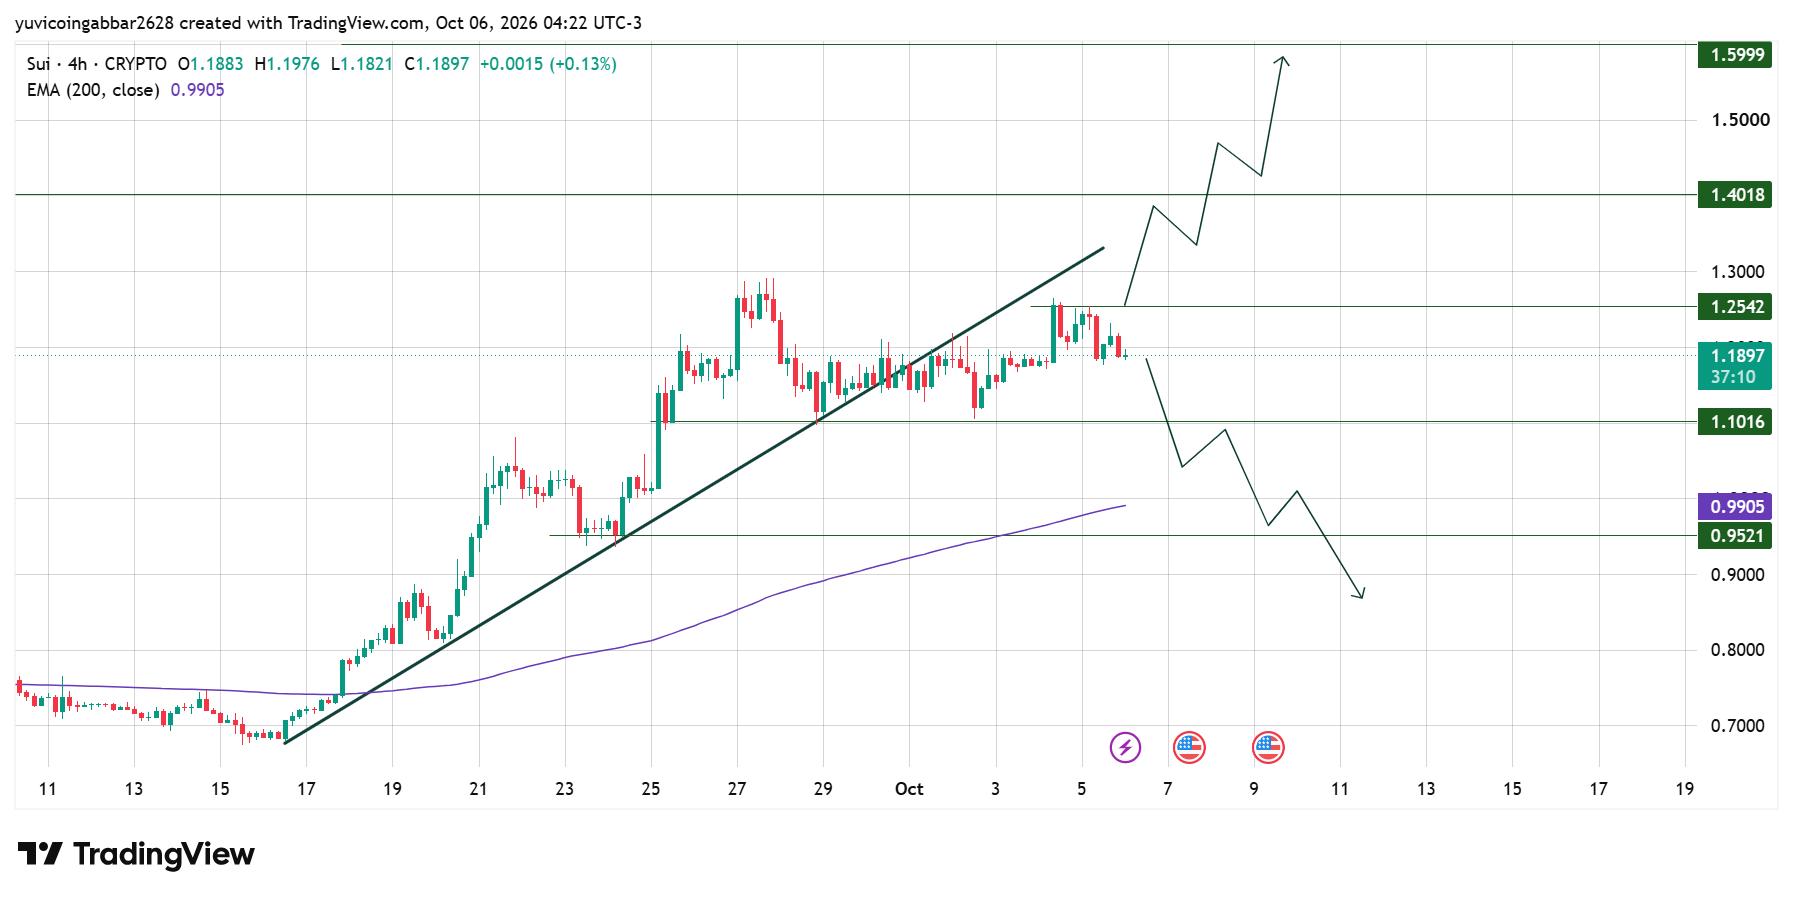
The price is holding below the rising trendline that has broken, and the price started from the lower levels and is also above the 200 EMA at $0.9905. This keeps the short-term structure constructive, but SUI is now approaching an important resistance area.
The first major resistance on the chart is $1.2542. A confirmed breakout and close above this level could strengthen the bullish setup.
Above that, the next key chart level is $1.4018, followed by the projected target at $1.5999.
On the downside, $1.1016 is the first support. If this level holds, buyers could continue trying to push the price toward the resistance zone.
A break below $1.1016 would weaken the setup and bring the lower support at $0.9521 into focus. The 200 EMA at $0.9905 is also an important level between these zones.
SUI Outlook: Key Support and Resistance Levels
Level | Type |
$1.5999 | Upside Target |
$1.4018 | Resistance |
$1.2542 | Immediate Resistance |
$1.1897 | Current Price |
$1.1016 | Key Support |
$0.9905 | 200 EMA |
$0.9521 | Deeper Support |
SUI Price Prediction: Can SUI Reach $1.60?
The chart shows $1.5999 as the key upside target.
For this move to develop, SUI first needs to break above $1.2542. A successful move through $1.2542 could open the path toward $1.4018.
If buyers continue to hold the higher structure and clear $1.4018, the chart projection points toward $1.5999.
However, the move is not confirmed yet. SUI is still trading below the first major resistance, making $1.2542 the key level to watch.
What Happens If SUI Breaks Support?
The bullish setup could weaken if SUI loses $1.1016.
A confirmed break below $1.1016 would put $0.9521 into focus. The 200 EMA at $0.9905 also becomes important because it currently sits between the two major support levels.
If buyers defend these levels, the price could attempt another recovery. If they fail, the current bullish structure would become weaker.
SUI Bull Case
Bull Case: SUI holds $1.1016, remains above the 200 EMA at $0.9905 and breaks $1.2542. A confirmed breakout could open the way toward $1.4018 and $1.5999.
SUI Bear Case
Bear Case: SUI loses $1.1016 and fails to reclaim the level. This could weaken the recovery setup and bring $0.9521 and the $0.9905 200 EMA into focus.
SUI Price Prediction: What Should Traders Watch Next?
The most important level on the current chart is $1.2542. SUI is trading at $1.1897, so buyers still need to clear this resistance before the next upside levels come into play.
Above $1.2542, the chart gives $1.4018 and $1.5999 as the next levels to watch.
On the other hand, $1.1016 remains the key support. Holding this level would keep the recovery structure intact, while a confirmed break below it could shift attention toward $0.9905 and $0.9521.
The $6 and $50 targets from the X posts are much more aggressive scenarios. For now, the chart provides a clearer roadmap: $1.2542 first, then $1.4018 and $1.5999.
SUI Price Prediction 2026: Expert View
According to CoinGabbar analysts, the current SUI setup remains cautiously constructive while the price holds above $1.1016 and the 200 EMA at $0.9905. However, the real confirmation would come from a breakout above $1.2542.
The $6 and $50 calls create a strong bullish narrative, but traders should separate those claims from the levels currently visible on the chart.
Until $1.2542 is cleared, the immediate focus remains on the current range and its key support and resistance levels.
Disclaimer
This article is for informational purposes only and is not financial advice. The SUI levels and scenarios are based on the provided TradingView chart and the referenced X posts. Crypto markets are highly volatile, and projected targets are not guaranteed. Always do your own research before making any investment decision.
0
0

 Manage all your crypto, NFT and DeFi from one place
Securely connect the portfolio you’re using to start.


