
Solana Price Prediction: Mystery Whale Dumps 1.49M SOL as ETFs Bleed

0
0
Solana is under pressure again. SOL traded at $94.29 at the time of writing, with a daily high of $95.70 and a low of $93.21. This Solana price prediction looks at whale deposits, ETF flows, derivatives data, and the daily chart.
Over seven days, the token is down 7.01%. Over 30 days, it has lost 20.96%.
Mystery Whale Keeps Sending SOL to Exchanges
On-chain tracker Lookonchain says a mysterious whale keeps dumping Solana In the past 10 days, the wallet deposited 1.49M SOL, worth $148.77M, into multiple exchanges.
The transfers came from a Fireblocks Custody address. They landed on Bybit, OKX, Kraken, Gate, Bitstamp and Bullish.
Some of the larger deposits include 32,027 SOL to OKX ($3.01M) and 25,635 SOL to Gate ($2.43M). Moving coins to exchanges does not always mean a sale. But traders often treat it as a warning sign.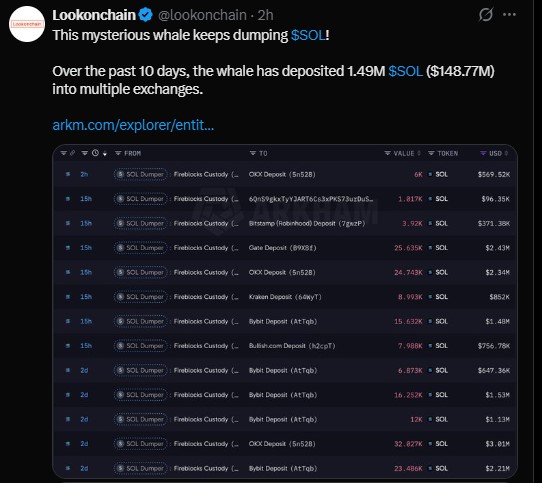
Solana ETFs Post Five Straight Days of Outflows
As per SoSoValue, the fund data is easier to check, since flows are published every trading day. From October 26 to 30, money left Solana spot ETFs on all five days. The total was about $71.5M.
Farside says $23.7M of the October 29 outflow came from Bitwise's BSOL. Another $4M came from Grayscale's GSOL.
Date (2026) | Daily Net Inflow | Total Net Assets |
Oct 26 | -$8.23M | $1.55B |
Oct 27 | -$19.16M | $1.54B |
Oct 28 | -$5.66M | $1.56B |
Oct 29 | -$27.69M | $1.50B |
Oct 30 | -$10.74M | $1.40B |
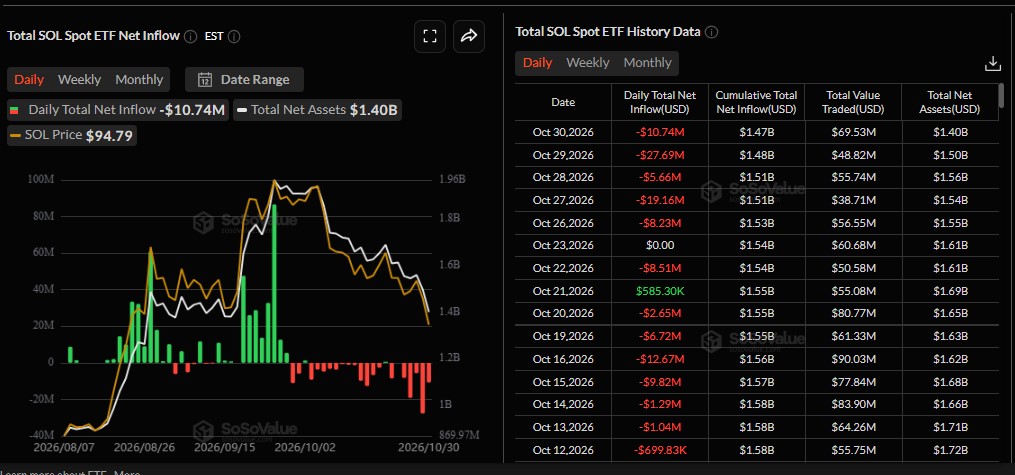
Source: SoSoValue
Data providers can differ by a few hundred thousand dollars. SoSoValue and Farside count trading days a little differently. So the figures here are quoted as each source reports them.
Cumulative net inflows still stand at $1.47B. Total net assets have dropped to $1.40B.
Derivatives Show a Market in Wait Mode
As per CoinGlass data, Futures volume reached $4.66B over 24 hours, up 93.81%. Spot volume was $451.92M. Open interest fell 2.10% to $5.70B.
Options volume jumped 170.79% to $12.63M. Options open interest rose 6.93% to $79.57M.
The overall long/short ratio is 1.0101. That points to a nearly balanced market.
Top traders lean long, though. Binance's top trader account ratio is 3.8054, and its position ratio is 2.5043.
Liquidations were small but long-heavy. In 24 hours, $7.08M was wiped out. Longs lost $5.21M, and shorts lost $1.87M.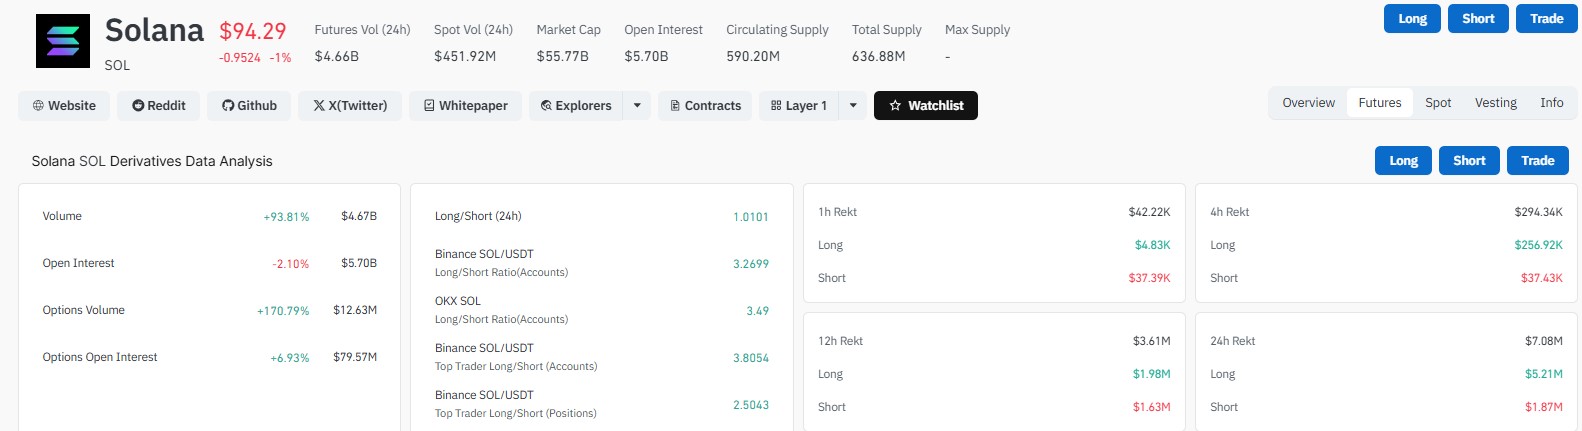
Solana Price Analysis: Bears Hold the Daily Chart
On the daily SOL/USDT chart, price is moving inside a descending channel. It has made lower highs and lower lows since the rejection near $120 to $122.
SOL sits below all four key moving averages. That is a bearish sign.
EMA | Level |
20 | $101.32 |
50 | $103.77 |
100 | $99.94 |
200 | $98.19 |
The RSI is at 28.60. That is oversold, so a short-term bounce is possible.
Key Levels to Watch in This Solana Price Prediction
Support sits between $93.20 and $92.00. A daily close below it could open a move toward $88 to $85.
If buyers defend that zone and reclaim $98 to $100, a recovery toward $103 to $108 could follow. That area also holds the EMA resistance.
The picture stays bearish until SOL breaks the channel's upper line and holds above the EMAs. No one can say which way it goes. Whale selling and ETF outflows could add pressure, while an oversold RSI could slow the fall.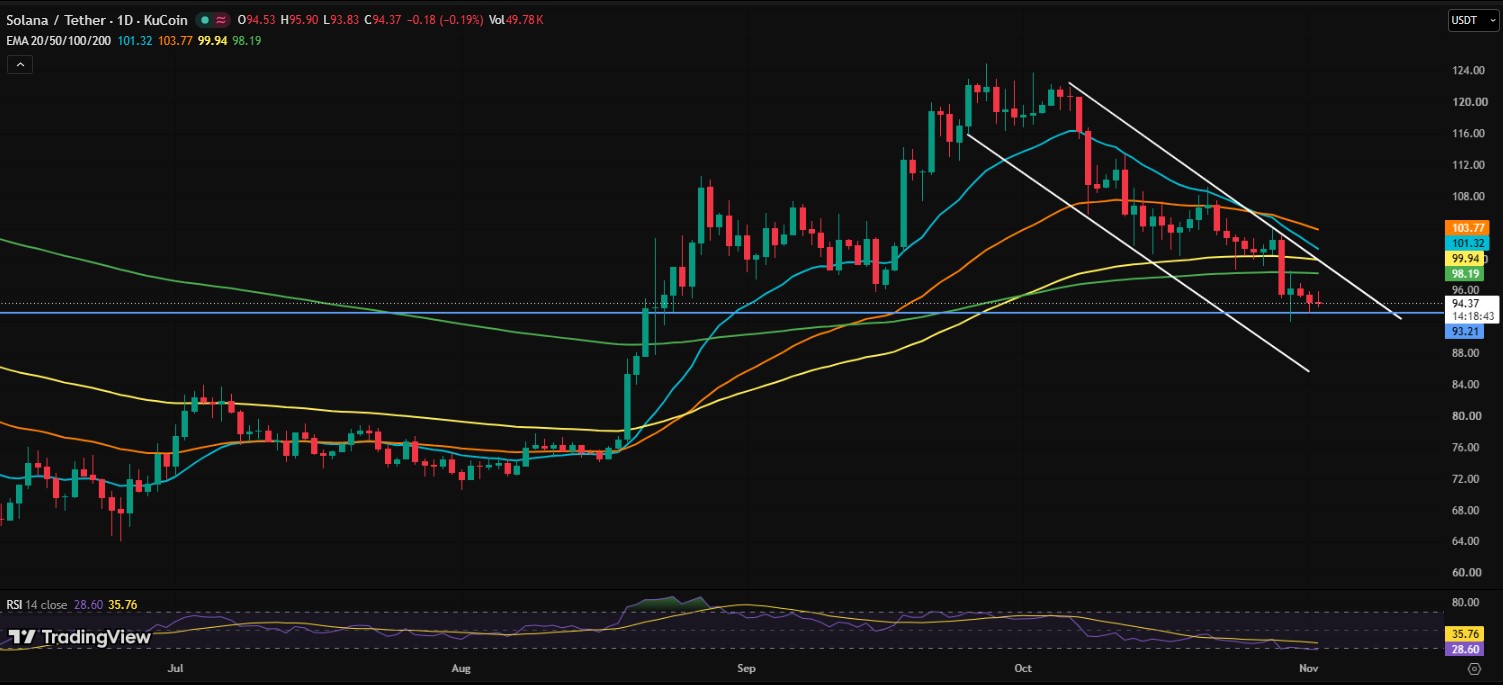
For now, this Solana price prediction depends on whether $93.20 holds.
Disclaimer
This article is for information only. It is not financial, investment, or trading advice. Cryptocurrency prices are highly volatile, and you can lose some or all of your money. Always do your own research and speak with a licensed financial advisor before making any decision.
0
0

 Manage all your crypto, NFT and DeFi from one place
Securely connect the portfolio you’re using to start.


