
Sui Price Prediction: 19B Transactions Hit! but Can SUI Hold $0.70?

0
0

Can SUI hold $0.70? Sui just passed 19 billion total transactions, yet price trades at $0.7243, below a falling trendline.
In this Sui Price Prediction, a trader says buyers may defend a key weekly zone, but the daily chart shows no bounce yet. A close above $0.8010 would be the first sign of strength.
Market data checked on November 17, 2026, at 16:38 IST.
Sui Price Prediction Today: Market Overview
SUI is trading at $0.7243, up 1% on the day. The candle opened at $0.7201 and has moved between a low of $0.7132 and a high of $0.7307.
SUI Liquidation Data: Longs Take 69%
A liquidation is a forced close of a leveraged trade when the trader can no longer cover losses. Longs bet on a rise, and shorts bet on a fall. Coinglass shows:
Window | Total Liquidated | Long | Short |
1h | $1.21K | $1.20K | $11.04 |
4h | $21.92K | $21.16K | $757.06 |
12h | $63.40K | $45.43K | $17.98K |
24h | $431.44K | $296.22K | $135.22K |
Longs took about 69% of the $431.44K liquidated over 24 hours.
Sui News Today: Network Passes 19 Billion Transactions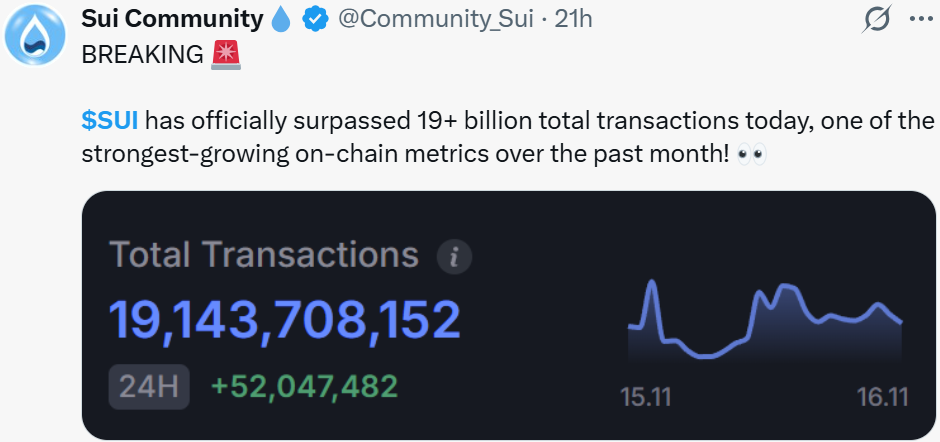
Sui Community posted on X about 21 hours before publication: "BREAKING. $SUI has officially surpassed 19+ billion total transactions today, one of the strongest-growing on-chain metrics over the past month!"
The attached dashboard shows 19,143,708,152 total transactions and 52,047,482 added in 24 hours.
Sui Price Prediction Outlook: Trader Eyes a Weekly Demand Zone
Aman posted: "$SUI bears have been enjoying this downtrend a little too much. But there's one small problem. Price is approaching the same weekly demand zone that previously triggered massive rallies.
If buyers defend this level again, some people are going to learn why catching a falling knife and shorting the bottom are two different ways to lose money."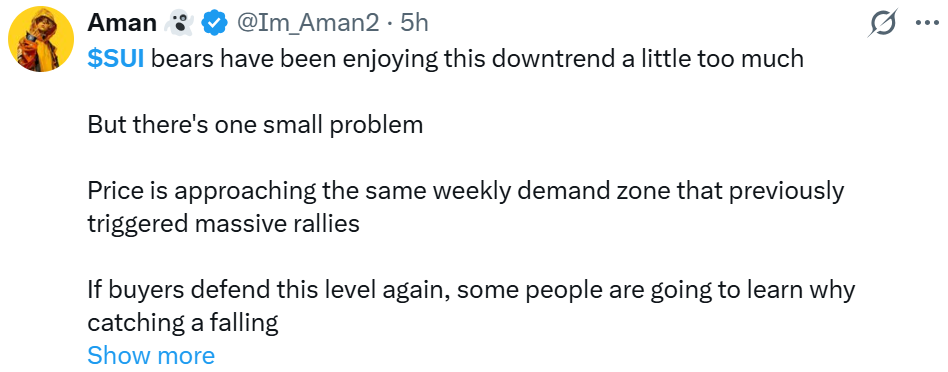
Source: Data From X
Sui Price Prediction 2026: Technical Analysis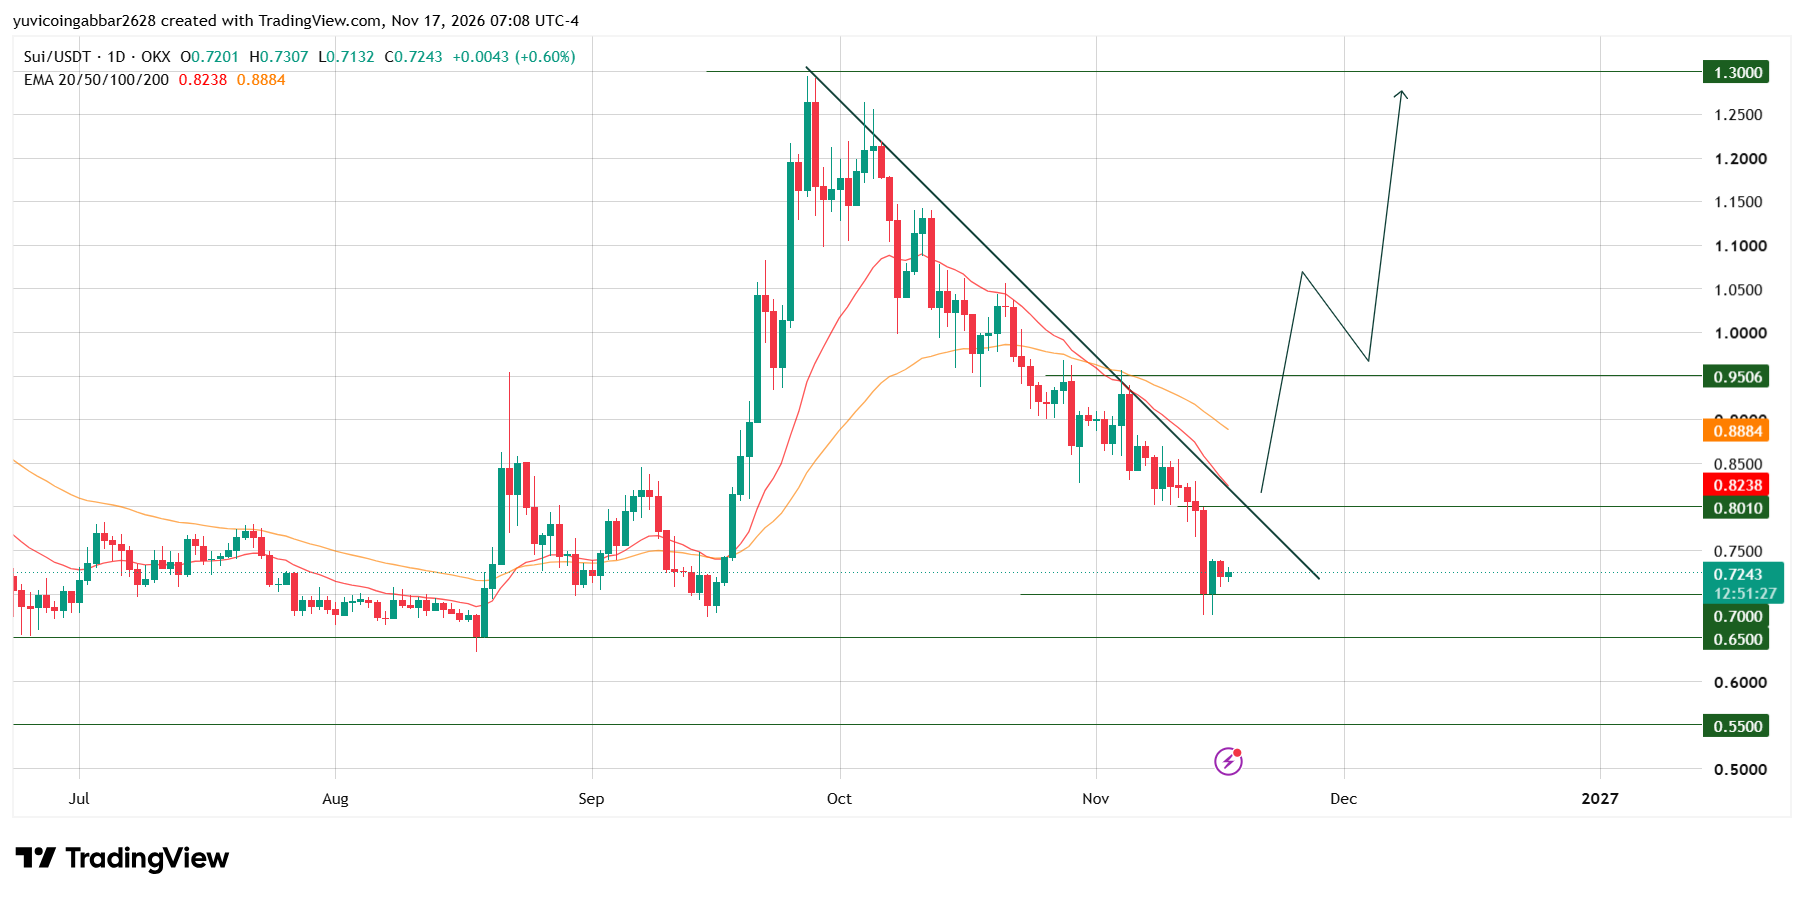
SUI peaked near $1.30 in late September. A falling trendline drawn from that peak has capped every rally since, including a test near $0.9506 in early November.
A long red candle on November 14 broke below $0.8010 and briefly went under $0.7000, where buyers stepped in. Today's candle opened at $0.7201 and is trading at $0.7243.
EMA, or exponential moving average, averages recent closes and weights newer days more. Price sits below both EMAs, and EMA 20 at $0.8238 is under EMA 50 at $0.8884.
Sui Forecast: $SUI Support and Resistance Levels
Type | Level |
Highest marked level | $1.3000 |
Resistance zone | $0.9506 |
Initial recovery level | $0.8010 |
Immediate price reference | $0.7243 |
First confirmed support | $0.7000 |
Deeper support | $0.6500 |
Lowest marked level | $0.5500 |
Sui Price Prediction Scenarios (November 17, 2026)
Bull scenario: For this Sui prediction, a daily close above $0.8010 would point to a move toward $0.9506. The setup fails if SUI closes back below $0.8010.
Base scenario: If SUI stays between $0.7000 and $0.8010, the price would likely move sideways. A break of either level ends the range.
Bear scenario: A daily close below $0.7000 would open a slide toward $0.6500. The setup fails if SUI closes back above $0.7000.
Sui Price Prediction: Can Sui Reach $1.30?
It would take a gain of about 79% from $0.7243. Any Sui price outlook toward $1.30 needs SUI to clear the falling trendline at $0.8010 and $0.9506 first.
Sui Price Prediction: CoinGabbar Technical Read (November 17, 2026)
Network use is rising while price falls, so the two are not moving together. Only a close above $0.8010 would confirm a bounce, while a close below $0.7000 would keep sellers in control. See our latest crypto price predictions.
Disclaimer
This article is for informational purposes only and isn't financial advice. Crypto markets are volatile. Always do your own research before making any trading decisions involving SUI.
0
0


 Manage all your crypto, NFT and DeFi from one place
Securely connect the portfolio you’re using to start.


