
Chainlink Price Prediction: Can LINK Beat $12.25 Resistance?

0
0

Is a quiet tape riskier than a loud one? LINK trades at $11.92 as of 12:00 UTC on October 20, 2026, and nobody's panicking.
That calm is what this Chainlink price prediction has to test. A descending channel keeps pressing on every bounce, as the October 2026 outlook already covered.
Chainlink Price Forecast: Where LINK Trades Now
Current Price and 24H Performance
LINK price today is $11.90 on CoinMarketCap price data, down 1.46% in 24 hours. Binance shows $11.92.
The 24-hour range ran from $11.85 to $12.13. Seven days show -5.52%. But 90 days still sit at +37.86%.
Trading Volume and Market Cap
Spot volume is $193.57M, down 20.56% in a day. Market cap is $8.9B, so volume to market cap is 2.17%.
That ratio shows how busy trading is compared with size. Low readings mean thin interest, much like the earlier volume stall.
Circulating supply is 748.09M of a 1B max. Fully diluted value is $11.9B.
Why Is Chainlink Moving Today?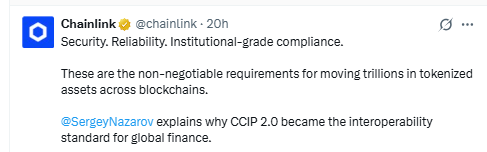
Slow bleed. Volume fading. Chainlink pushed a CCIP 2.0 post about institutional-grade interoperability. Price barely reacted. Sellers still run the 4-hour trend.
Chainlink Technical Analysis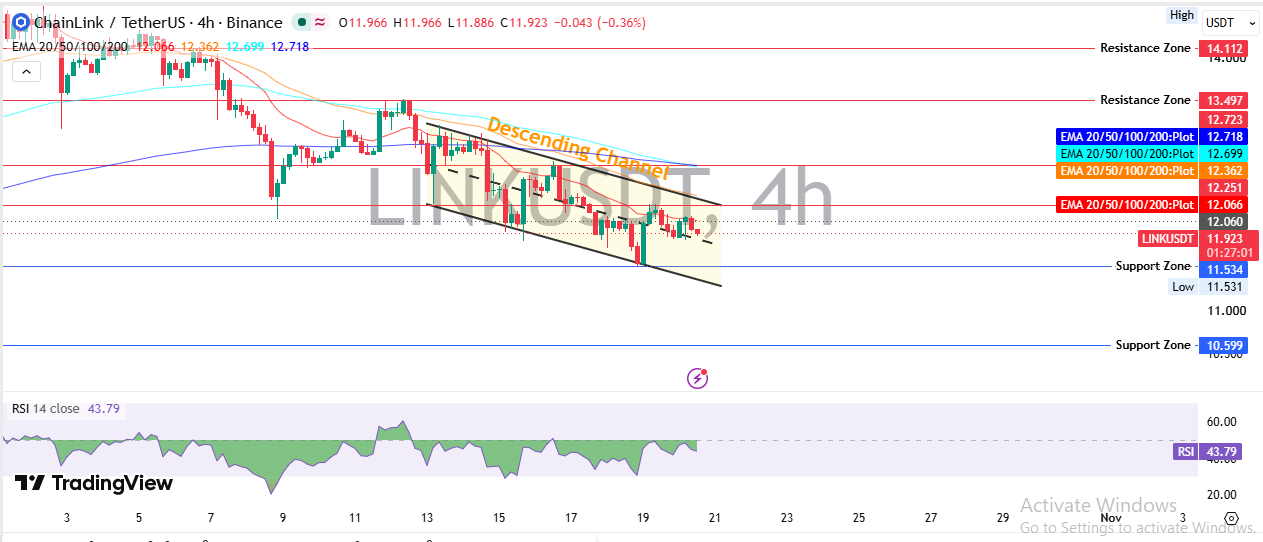
Descending Channel and EMA Stack
A descending channel is two sloping lines that cage price between lower highs and lower lows. On the TradingView 4-hour chart, LINK trades inside one.
The 20 EMA sits at $12.066, the 50 EMA at $12.362, the 100 EMA at $12.699 and the 200 EMA at $12.718. Price trades under all four. Bearish, plainly.
RSI sits at 43.79. Not oversold, not overbought. And that matters, because sellers lead without being exhausted. Reversals still happen, as the reserve buy bounce coverage showed.
Key Support Levels
LINK support and resistance start below. Support is a zone where buyers stepped in before.
First sits $11.534, next to the $11.531 low. Then $10.599, about 11% under spot, a level that echoes the CPI selloff support test.
Key Resistance Levels
Resistance is where sellers pushed the price back before. First comes $12.251, then $13.497 and $14.112.
The EMA cluster near $12.70 adds friction, much like the earlier channel test. But one break above $12.251 won't repair the trend. And bulls need the 100 and 200 EMAs next.
Chainlink Whale Holders
Supply Concentration
A whale is a wallet holding a huge amount of a coin. Etherscan counts 916,924 holders, and 4,111 whales (0.45% of holders) control 90.65% of the market cap tier, per Etherscan holder data.
Bearish worry first. Then again, many top wallets are Chainlink's own noncirculating supply at 30M LINK each, and that isn't automatic selling. Binance holds 42.19M LINK, or 4.2194%.
Futures Positioning
Open Interest and Liquidations
Open interest is the total of open futures contracts. CoinGlass LINK data shows $584.06M, with futures volume at $307.52M against $44.92M in spot.
Liquidations are forced exits from borrowed-money bets. Over 24 hours, $594.23K got wiped out, and $532.08K of it was long.
Longs got hurt. Binance long/short sits at 1.5445 and OKX at 2.9. If longs keep crowding in, who's left to buy?
Chainlink ETF Flows
Spot ETF Demand
Chainlink ETF products hold $210.49M, or 2.36% of market cap, with cumulative net inflow at $179.23M per SoSoValue ETF data.
Net flow was 0onOctober19,after-397.26K on October 16. Grayscale's GLNK holds $150.82M and Bitwise's CLNK $59.67M.
Demand paused. A pause isn't an exit. But it isn't support either.
Catalyst Watch
Link:NYC and CCIP 2.0
Link:NYC is ten days away per the Link:NYC announcement, roughly October 30, 2026. Events pull attention. They don't guarantee buyers, and sell-the-news moves happen.
Chainlink Price Prediction Scenarios
Weekly flows would need to revive the record ETF inflow pace for upside to gain trust. The table below covers the next 7 to 30 days.
Scenario | Trigger | Target | Invalidation | Liquidity Condition |
Bear | Trades below $11.534 with rising volume | $10.599 | Reclaim of $12.066 (20 EMA) | Thin spot volume, more long liquidations |
Base | Holds $11.534 to $12.251 inside channel | $11.534 to $12.251 range | Break of either edge | Volume near $193.57M, flat ETF flows |
Bull | Breaks and holds above $12.251, then $12.72 | $13.497, then $14.112 | Falls back under $12.066 | Spot leads futures, ETF inflows return |
Bear Case
The near-term bias leans bearish. Price sits under four EMAs, and longs took the damage.
A LINK price prediction of $10.599 needs a clean break of $11.534 first.
Base Case
Most likely, LINK chops between $11.534 and $12.251 while the channel plays out. Boring? Yes. Useful? Also yes.
Bull Case
A push above $12.251 would target $13.497 if volume backs it. And fresh ETF buying, like the DTCC news stretch, would help. That's the harder road. Not impossible.
Risks That Could Change the Chainlink Price Forecast
A channel breakdown, whale wallet movement, stalled ETF demand and event sell-offs could all flip the setup. The wallet count news shows how fast holder data shifts.
Final Takeaway
Bearish near term, neutral if $11.534 holds. Watch $12.251 for the first real change.
Disclaimer: This Chainlink price prediction is for information only and isn't financial advice. Crypto prices swing fast, and scenarios aren't guarantees. Research independently before any trade.
0
0


 Manage all your crypto, NFT and DeFi from one place
Securely connect the portfolio you’re using to start.


