
XRP Price: Will the Fed Meeting Affect It? 90.6% Odds Say No Change

0
0

XRP is trading near $1.319 on October 23, down 0.63% in 24 hours. The token has a market cap of $83.14 billion.
Traders are watching exchange outflows, ETF flows, and next week's Fed meeting. This XRP price prediction guide uses real numbers from each.
What Is the XRP Price Today?
The $XRP price today is $1.319. Futures volume is $2.47 billion, down 20.91%. Spot volume is $416.38 million.
Open interest is $2.90 billion, down 2.35%. Options open interest is $69.44 million, down 1.54%.
Metric | Value | 24h Change |
Price | $1.319 | -0.63% |
Market cap | $83.14B | N/A |
Futures volume | $2.47B | -20.91% |
Open interest | $2.90B | -2.35% |
Options volume | $3.10M | -13.48% |
Circulating supply is 63.12 billion coins. Total supply is 99.98 billion, and the max supply is 100 billion.
Why Is XRP Down Today?
The overall long/short ratio is 0.8864, so shorts hold a slight edge. Exchange data is different. Binance accounts show 3.2863, and OKX shows 3.8, both strongly long.
Binance top traders are long too, at 3.9407 by accounts and 2.2596 by positions.
Window | Total Liquidated | Longs | Shorts |
1 hour | $97.77K | $97.77K | $0 |
4 hours | $114.72K | $110.29K | $4.43K |
12 hours | $365.97K | $118.30K | $247.68K |
24 hours | $4.30M | $3.92M | $379.97K |
Long traders took most of the 24-hour pain. The amounts are small, so this looks like a quiet market, not a panic.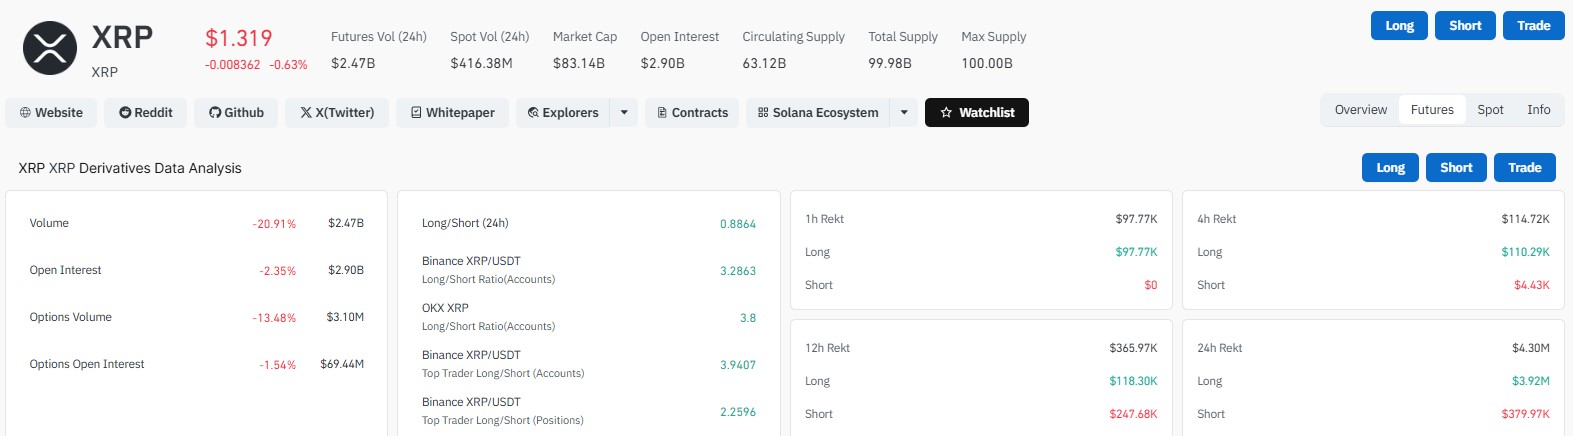
What Is the Latest XRP News on Exchange Outflows?
CryptoQuant data shared by Arab Chain shows about 5.3 billion $XRP left trading platforms in 30 days.
Binance saw about 2.2 billion. OKX had around 501 million, and Bybit about 480 million.
Coins leaving exchanges can mean holders are moving them to private wallets. That may cut selling pressure, but it does not promise a rally.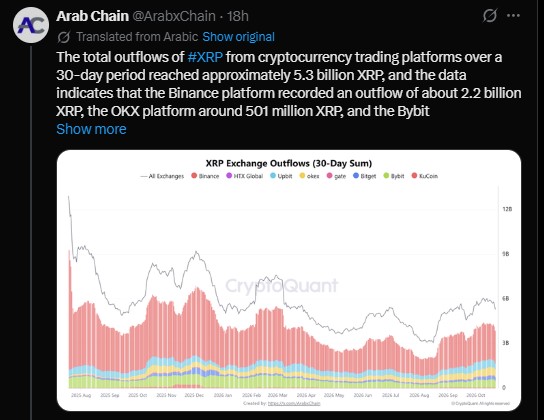
Are XRP ETFs Still Seeing Inflows?
Yes, though daily flows are small. On October 22, total net inflow was $3.55 million. Cumulative net inflow is $1.80 billion.
Total net assets are $1.49 billion, or 1.81% of the market cap. Total value traded was $16.39 million.
Fund | Sponsor | Net Assets | Cumulative Inflow | Premium/Discount | Fee | Daily Change |
$XRP | Bitwise | $544.43M | $683.19M | -0.43% | 0.34% | -6.32% |
XRPZ | Franklin | $400.04M | $518.60M | -0.18% | 0.19% | -6.10% |
XRPC | Canary | $318.25M | $484.34M | -0.44% | 0.50% | -6.48% |
TOXR | 21Shares | $140.28M | -$21.15M | -0.24% | 0.30% | -6.00% |
GXRP | Grayscale | $85.31M | $145.38M | -0.15% | 0.35% | -6.28% |
Only Franklin's XRPZ saw inflow that day, $3.55 million or 2.71 million coins. All five funds trade at a small discount. TOXR is the only fund with negative cumulative flows.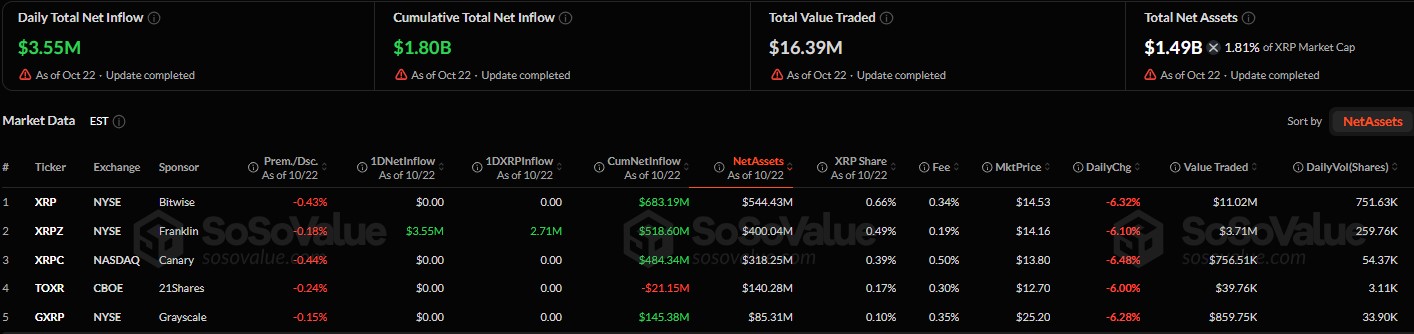
Will the Fed Meeting Affect the XRP Price?
The Fed meets on October 28. The current range is 3.75% to 4.00%.
CME data shows a 90.6% chance of no change and a 9.4% chance of a hike. One month ago, a hike was priced at 70.9%. Expectations have cooled a lot.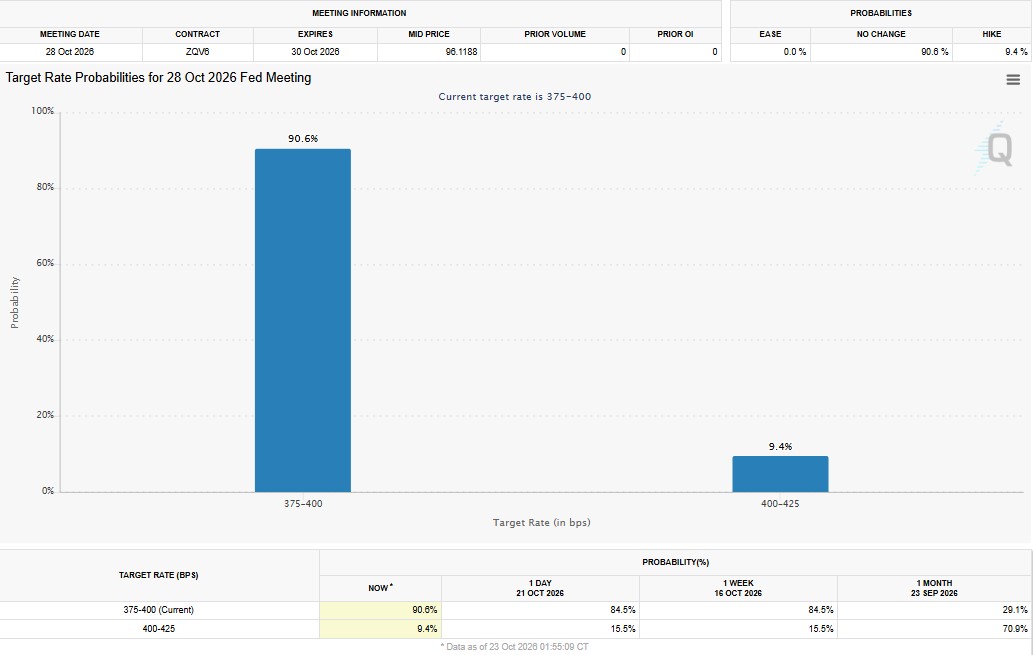
What Is the XRP Price Forecast Based on the Charts?
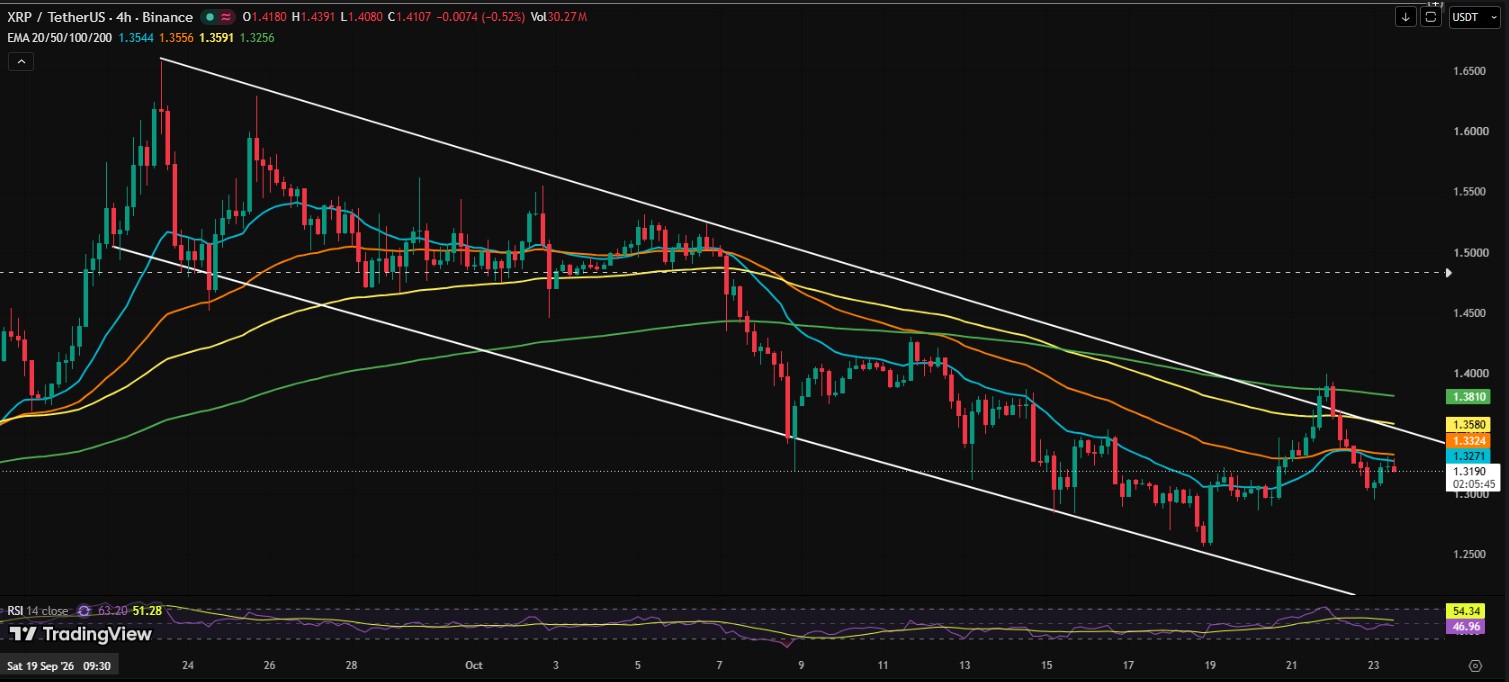
The 4-hour chart shows a descending channel with lower highs and lower lows. A bounce stalled near $1.38 to $1.40.
Price sits at $1.319, under all four moving averages. The 20 EMA is $1.3271, the 50 is $1.3324, the 100 is $1.3580, and the 200 is $1.3810.
RSI is near 47, which is neutral to weak.
Analyst EGRAG Crypto sees an ABC correction on the daily chart. A was $1.25, B was $1.65, and C could be $1.20. He calls the diamond pattern unconfirmed.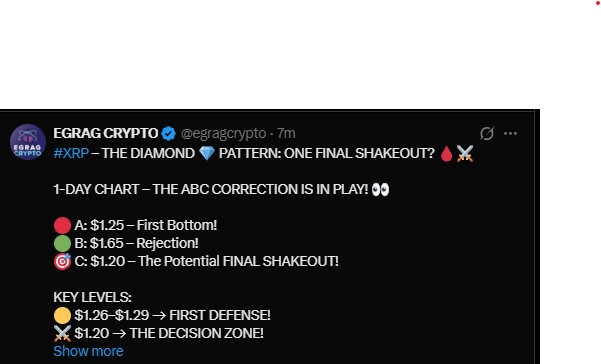
What Are the Key XRP Support and Resistance Levels?
Level | What It Means |
$1.45 to $1.40 | Reclaiming this zone could cancel the bearish view |
$1.38 to $1.40 | Recent rejection and channel resistance |
$1.33 to $1.36 | First hurdle for buyers |
$1.30 to $1.28 | Immediate support |
$1.26 to $1.29 | First defense, per EGRAG |
$1.25 | Lower channel boundary |
$1.20 | Decision zone |
$1.15 to $1.11 | Deeper liquidity area |
Is the Ripple Price Prediction Bullish or Bearish?
The short-term bias is bearish to sideways. A drop below $1.28 would put $1.25 and $1.20 in play.
EGRAG expects downside liquidity first, then a possible move up. A move above $1.38 to $1.40 would be the first reversal sign, with $1.45 to $1.48 next.
Nobody can say which path wins. Lower volume, strong ETF assets and big exchange outflows all point different ways.
Disclaimer
This article is for information only and is not financial advice. Crypto assets are volatile, and you can lose money. Forecasts and analyst views are opinions, not guarantees. Do your own research and speak with a licensed financial advisor before making any investment decision.
0
0

 Manage all your crypto, NFT and DeFi from one place
Securely connect the portfolio you’re using to start.


