
XRP Slips to $1.33 as Fed Meeting Nears: Key Levels to Watch

0
0
XRP price today is near $1.33, down 2.1% in 24 hours. The coin has traded inside a falling channel since late September.
Traders now eye the Fed meeting on October 28. Leverage is cooling, ETFs still see inflows, and key chart levels sit close to price.
What Is the XRP Price Today?
Metric | Latest Figure |
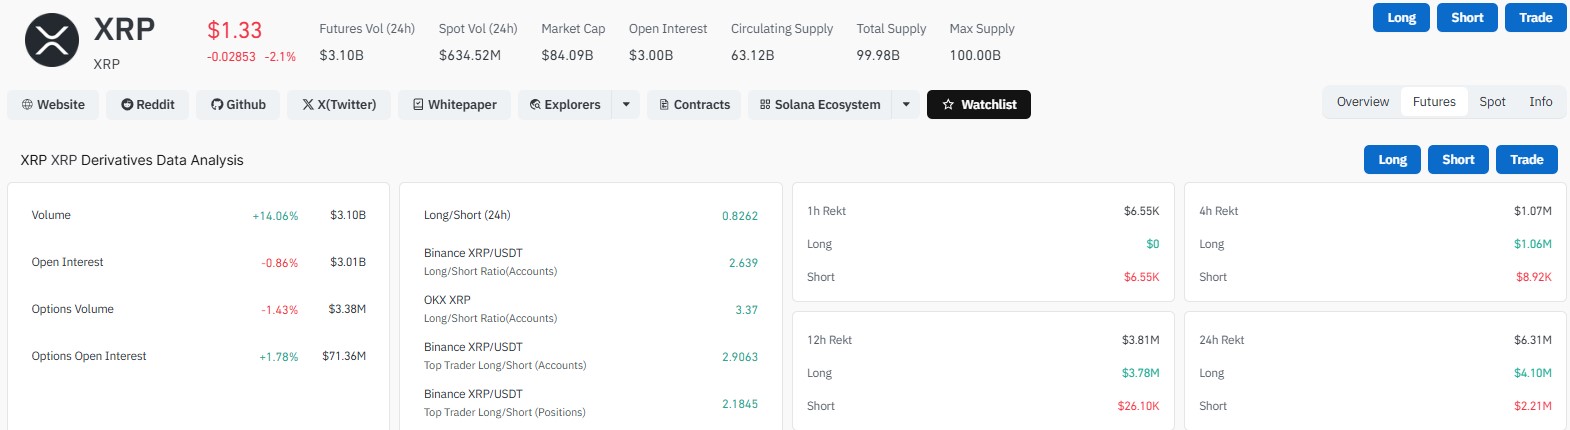
Price | $1.33 (down 2.1%) |
Market cap | $84.09 billion |
Circulating / total/max supply | 63.12B / 99.98B / 100B |
Spot volume (24h) | $634.52 million |
Futures volume (24h) | $3.10 billion (up 14.06%) |
Open interest | $3.01 billion (down 0.86%) |
Options volume | $3.38 million (down 1.43%) |
Options open interest | $71.36 million (up 1.78%) |
XRP News Today: Why Is XRP Down?
The daily candle opened at $1.3654 and hit a low of $1.3252. It now trades near $1.3300, down 2.59%.
Spot volume is $634.52 million. Futures volume is $3.10 billion, up 14.06%, while open interest slipped 0.86% to $3.01 billion.
Leverage is cooling too. CryptoQuant data shared by Arab Chain shows the Binance estimated leverage ratio fell from 0.229 in September to about 0.169. That is a 26.2% drop in under a month.
Fewer leveraged bets can mean fewer forced sales later. It can also mean traders feel less sure.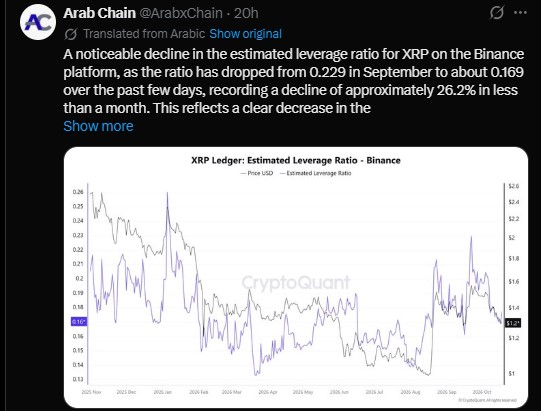
What Is the XRP Long/Short Ratio Today?
The 24-hour long/short ratio is 0.8262, so shorts hold a slight edge overall. Account ratios look different: 2.639 on Binance and 3.37 on OKX. Top Binance traders show 2.9063 by accounts and 2.1845 by positions.
The signals are mixed. Longs also took more pain in liquidations.
Time Frame | Total Liquidations | Long | Short |
1 hour | $6.55K | $0 | $6.55K |
4 hours | $1.07M | $1.06M | $8.92K |
12 hours | $3.81M | $3.78M | $26.10K |
24 hours | $6.31M | $4.10M | $2.21M |
XRP Latest News: Are XRP ETFs Still Seeing Inflows?
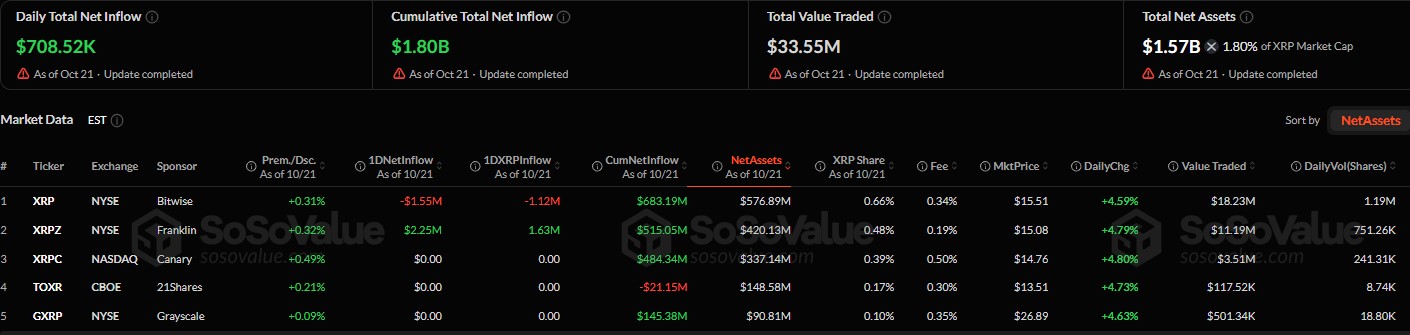
Yes, but the daily number is small. SoSoValue data shows $708.52K in net inflows on October 21.
Total net assets are $1.57 billion, or 1.80% of market cap. Cumulative inflows are $1.80 billion, and value traded was $33.55 million.
All five funds gained between 4.59% and 4.80% that day.
Fund | Net Assets | 1-Day Inflow | Cumulative Inflow |
Bitwise (XRP) | $576.89M | -$1.55M | $683.19M |
Franklin (XRPZ) | $420.13M | +$2.25M | $515.05M |
Canary (XRPC) | $337.14M | $0 | $484.34M |
21Shares (TOXR) | $148.58M | $0 | -$21.15M |
Grayscale (GXRP) | $90.81M | $0 | $145.38M |
How Will the Fed Meeting Affect XRP?
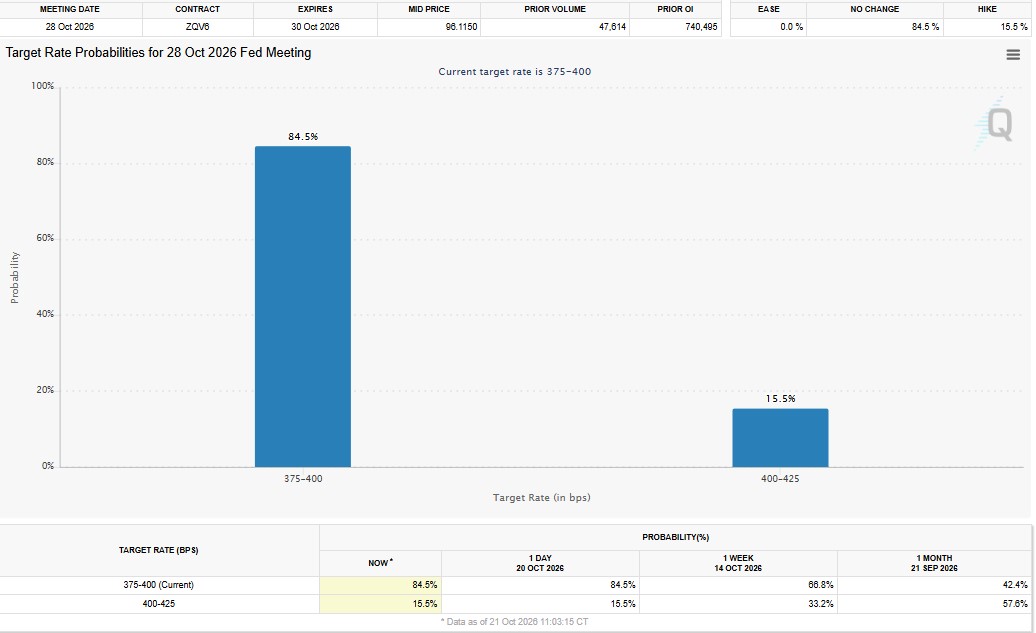
CME data puts the target rate at 3.75% to 4.00%. Markets give 84.5% odds of a hold on October 28, 15.5% for a hike, and 0% for a cut.
A surprise could move the whole crypto market, not just this coin.
Data Date | Hold (3.75% to 4.00%) | Hike (4.00% to 4.25%) |
Now (Oct 21) | 84.5% | 15.5% |
1 week ago | 66.8% | 33.2% |
1 month ago | 42.4% | 57.6% |
What Are the XRP Support and Resistance Levels?
The daily chart shows a descending channel that began near the $1.66 high in September. Each bounce has made a lower high.
Price sits under all four moving averages: 20-day EMA $1.3686, 50-day $1.3743, 100-day $1.3371, and 200-day $1.3747. The RSI is 42.72, which is weak but not oversold.
Level | Role |
$1.45 to $1.50 | Upside zone |
$1.37 to $1.40 | Resistance and channel top |
$1.30 to $1.28 | Key support |
$1.25 | Next support |
$1.20 | Lower channel area |
XRP Price Forecast: Will XRP Go Up or Down?
Any XRP price prediction is a guess. A Ripple price prediction built on one chart can fail fast.
If buyers hold support and the coin closes above $1.37 to $1.40, a move toward $1.45 to $1.50 becomes possible. It would also need a break above the channel trendline.
If $1.30 to $1.28 fails, the next areas are $1.25 and $1.20.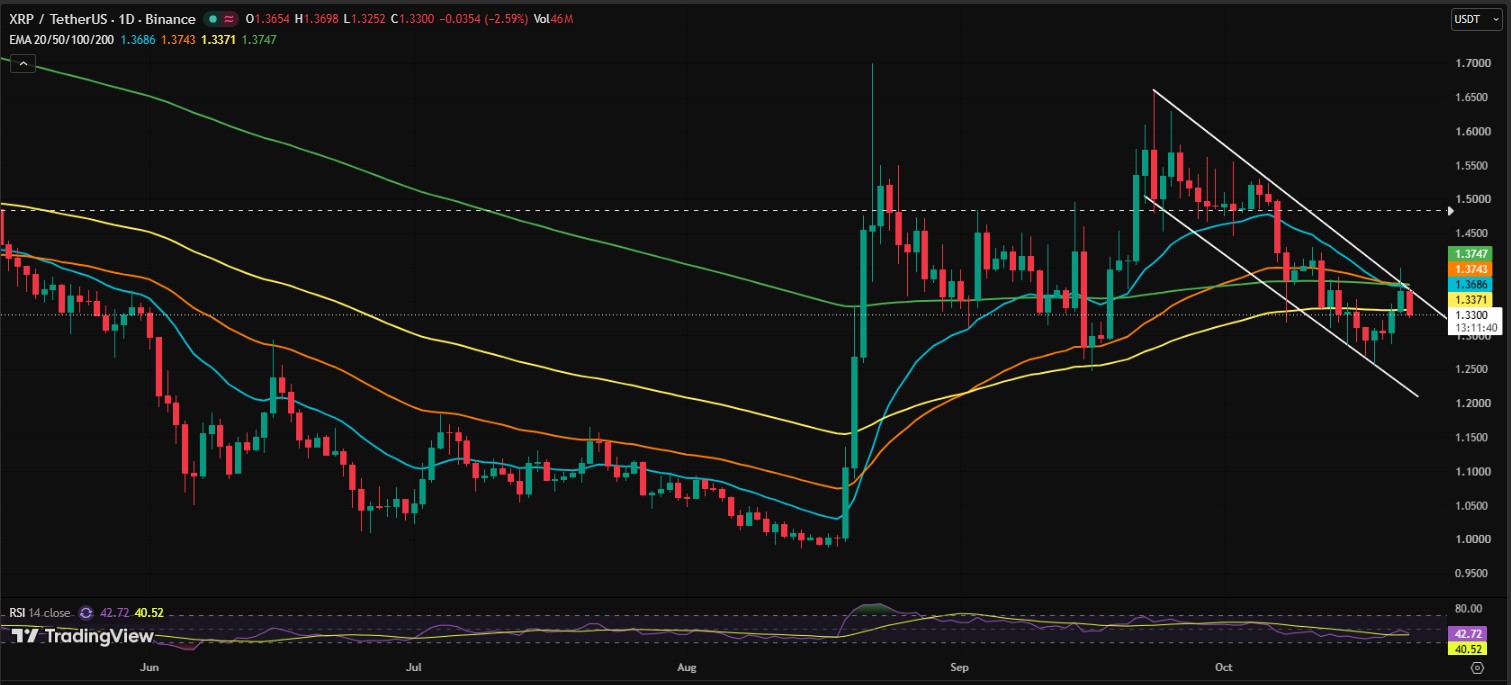
Cooling leverage, ETF inflows, and lower hike odds are mild positives. Lower highs and weak momentum are the worry. The short-term view stays cautious.
Disclaimer
This article is for information only and is not financial advice. Crypto is volatile, and you can lose money. Do your own research and speak to a licensed advisor before you trade.
0
0

 Manage all your crypto, NFT and DeFi from one place
Securely connect the portfolio you’re using to start.


