
Bitcoin Signals Potential Repeat Pattern After 2023 $25K Retest

0
0
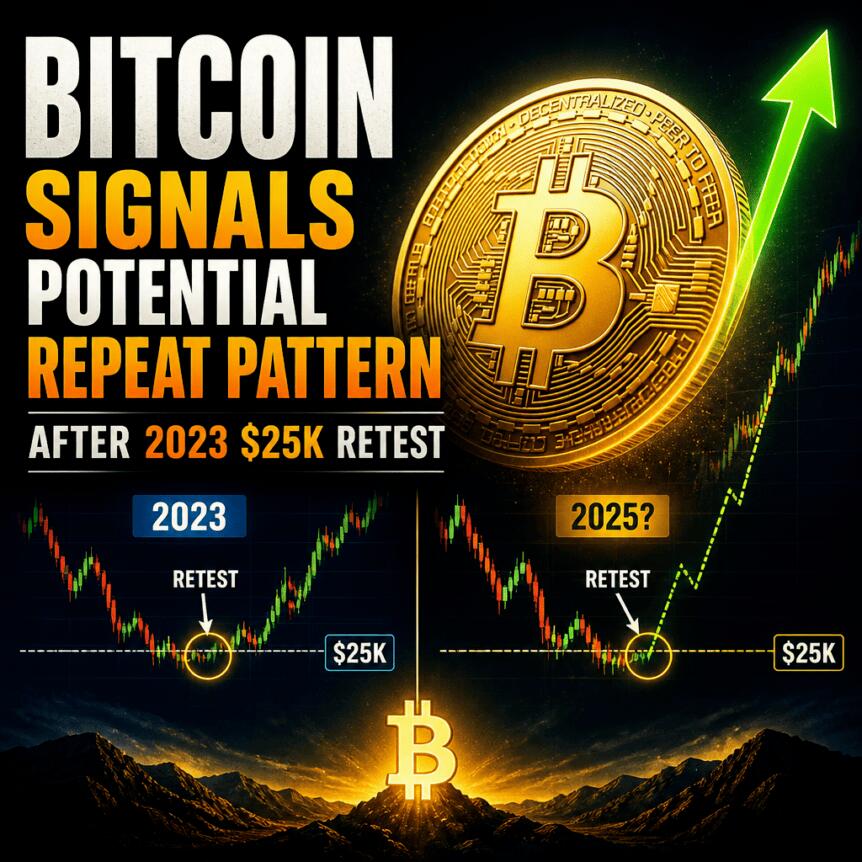
Bitcoin’s chart is flashing a familiar bearish signal: closely timed moving-average crossovers that, in the past, have appeared in the run-up to major drawdowns and subsequent retests of key support levels. Analyst Keith Alan says the current setup on the BTC/USD daily chart could resemble the pattern seen earlier in the cycle before Bitcoin tested $25,000 in September 2023.
According to Alan, Bitcoin’s 21-day simple moving average (SMA) crossed below the 200-day SMA on Thursday, and he expects the 50-day SMA to fall below the 100-day SMA before the weekly close—an arrangement traders often describe as a “death cross” configuration.
Key takeaways
- On Bitstamp’s BTC/USD daily chart, the 21-day SMA crossed below the 200-day SMA on Thursday.
- Keith Alan expects the 50-day SMA to cross below the 100-day SMA by the end of the week.
- In the only other instance Alan cites, the paired crossovers occurred between August and September 2023, ahead of a BTC/USD retest near $25,000.
- BTC fell to a 20-week low of $61,231 on Friday following a Thursday tech sell-off tied to Anthropic’s Nasdaq debut.
Why Alan is watching the “double death cross” timing
In a new analysis posted by Keith Alan, the cofounder of trading platform Material Indicators, he compared the current moving-average behavior with a prior moment in Bitcoin’s history. On the Bitstamp daily chart, the 21-day SMA slipped under the 200-day SMA on Thursday.
Alan notes that this type of 21-day/200-day cross last occurred in early November 2025. In his framing, that earlier cross emerged roughly a month after Bitcoin’s then-all-time high of $126,200, during the early phase of the market’s subsequent downturn.
The broader “death cross” sequence, Alan adds, completed later in that cycle when the 50-day SMA crossed below the 200-day SMA toward the end of November 2025—forming a more classic bearish structure. Now, he believes Bitcoin may be moving toward another confirmation step as the 50-day SMA approaches the 100-day SMA.
Alan’s key point is the pattern’s rarity and timing. He suggests the market currently matches the placement and cadence of a similar event from 2023, when both moving-average pairs effectively produced “death cross” behavior within the same general window. “We’ve only seen this happen once before in Bitcoin’s history, and it should not be ignored,” Alan wrote in the X post linked to his analysis.
What happened after the similar setup in 2023
The earlier instance Alan references ran between August and September 2023. During that period, Bitcoin later retested support around $25,000—specifically around Sept. 11—according to the article’s timeline.
Alan described that subsequent price action as a turning point: he characterizes the retest and the ensuing recovery as the start of a rally that carried Bitcoin to a 2023 peak of $44,700 in early December. In his summary, that move represented an increase of about 80% from the referenced turning point.
At the same time, Alan cautions against overfitting. He argues that one occurrence is not a robust sample size for treating it as a dependable model for future returns or for forecasting the magnitude of drawdowns. Still, he believes the shared characteristics—especially timing, placement, and the structure of the chart candles—are similar enough that investors and traders should pay attention rather than dismiss it as coincidence.
Friday’s drop extends Bitcoin’s weakness near the $61K area
The moving-average commentary arrives as Bitcoin’s spot price continued to weaken in the short term. Earlier coverage noted that Bitcoin lost support at the 200-week SMA for the first time since mid-August—an important reference point because that trend line often behaves differently depending on whether the market is in a bull-market retracement phase or rebounding from below it.
On Friday, BTC/USD reportedly traded down to $61,231, a 20-week low dating back to July 3. The article attributes the immediate pressure to a broader risk-off move in tech markets on Thursday, after Anthropic’s record IPO and Nasdaq debut.
According to the piece, the Nasdaq Composite Index closed Thursday down 2.25% at 23,879 points, marking its lowest daily close since April 14. In the same window, the article says Anthropic shares traded around $91.50 before Friday’s open and closed Thursday at $97.17—20% below the day’s $115 peak.
That sequence matters for how traders interpret Bitcoin’s chart. Even if moving-average crossovers are slow-moving technical signals, short-term momentum can be amplified when broader equity markets sell off—especially during periods when investors rotate toward cash or reduce exposure across high-beta assets.
What to watch as the crossovers develop
Alan’s forecast focuses on the next step in the bearish sequence: a potential 50-day SMA crossing below the 100-day SMA by the end of the week. If that confirmation occurs, it would add another layer to the “death cross” narrative traders commonly monitor, even if, as Alan notes, historical frequency alone can’t validate a repeatable outcome.
For investors and active traders, the most practical takeaway is to treat this as a developing technical regime rather than a single-event trigger. The pattern’s earlier occurrence in 2023 suggests that major support tests do not always mean the immediate collapse of the trend—yet the same signals can also coincide with sustained weakness, especially when macro pressure aligns.
Going forward, market participants will likely look for two things in tandem: whether the remaining crossover confirmations happen on schedule, and whether Bitcoin can stabilize around the recent lows as equity volatility cools or persists. In either case, the coming week could be pivotal for how traders interpret the seriousness—and timing—of the current bearish setup.
This article was originally published as Bitcoin Signals Potential Repeat Pattern After 2023 $25K Retest on Crypto Breaking News – your trusted source for crypto news, Bitcoin news, and blockchain updates.
0
0

 Manage all your crypto, NFT and DeFi from one place
Securely connect the portfolio you’re using to start.
 Where will Bitcoin trade next?
Live Polymarket and Kalshi odds on Bitcoin price targets, compared side by side.
See Bitcoin price odds


