
Price Prediction 10/26: BTC, ETH, BNB, XRP, SOL, ZEC

0
0
XRP held out amid the selloff that swept through the crypto market over the weekend. As a result, it maintained a support level it has held since August.
However, the altcoin is trading down a few percent on Monday as selling pressure intensifies. Whether it can continue holding this support remains uncertain. Nonetheless, the current wave of bearish price action is not limited to XRP.
The global cryptocurrency market is also trading below its opening price, reflecting the spillover from the previous day’s sentiment, which ended with slight losses. On the 1-day chart, a red close on Monday would mark the fourth consecutive day of declines.
Interestingly, several geopolitical developments made the rounds last week, contributing to both the rise and fall in prices. US economic data releases were relatively limited during the same period. However, the next four days will be anything but quiet, with the PCE report and interest rate decision among the most anticipated events.
The FOMC may signal a policy shift, as some members indicated during the previous meeting. Meanwhile, analysts are also forecasting a significant increase in the PCE metric, potentially heightening inflation concerns.
While the fundamentals suggest another bearish week, let’s examine what the charts indicate about the market’s direction over the next few days.
BTC/USD
BTC shed a few percent in the early hours of Monday but has since recovered some of its losses. It recently flipped green on the 1-day chart and may be gearing up for further recovery.
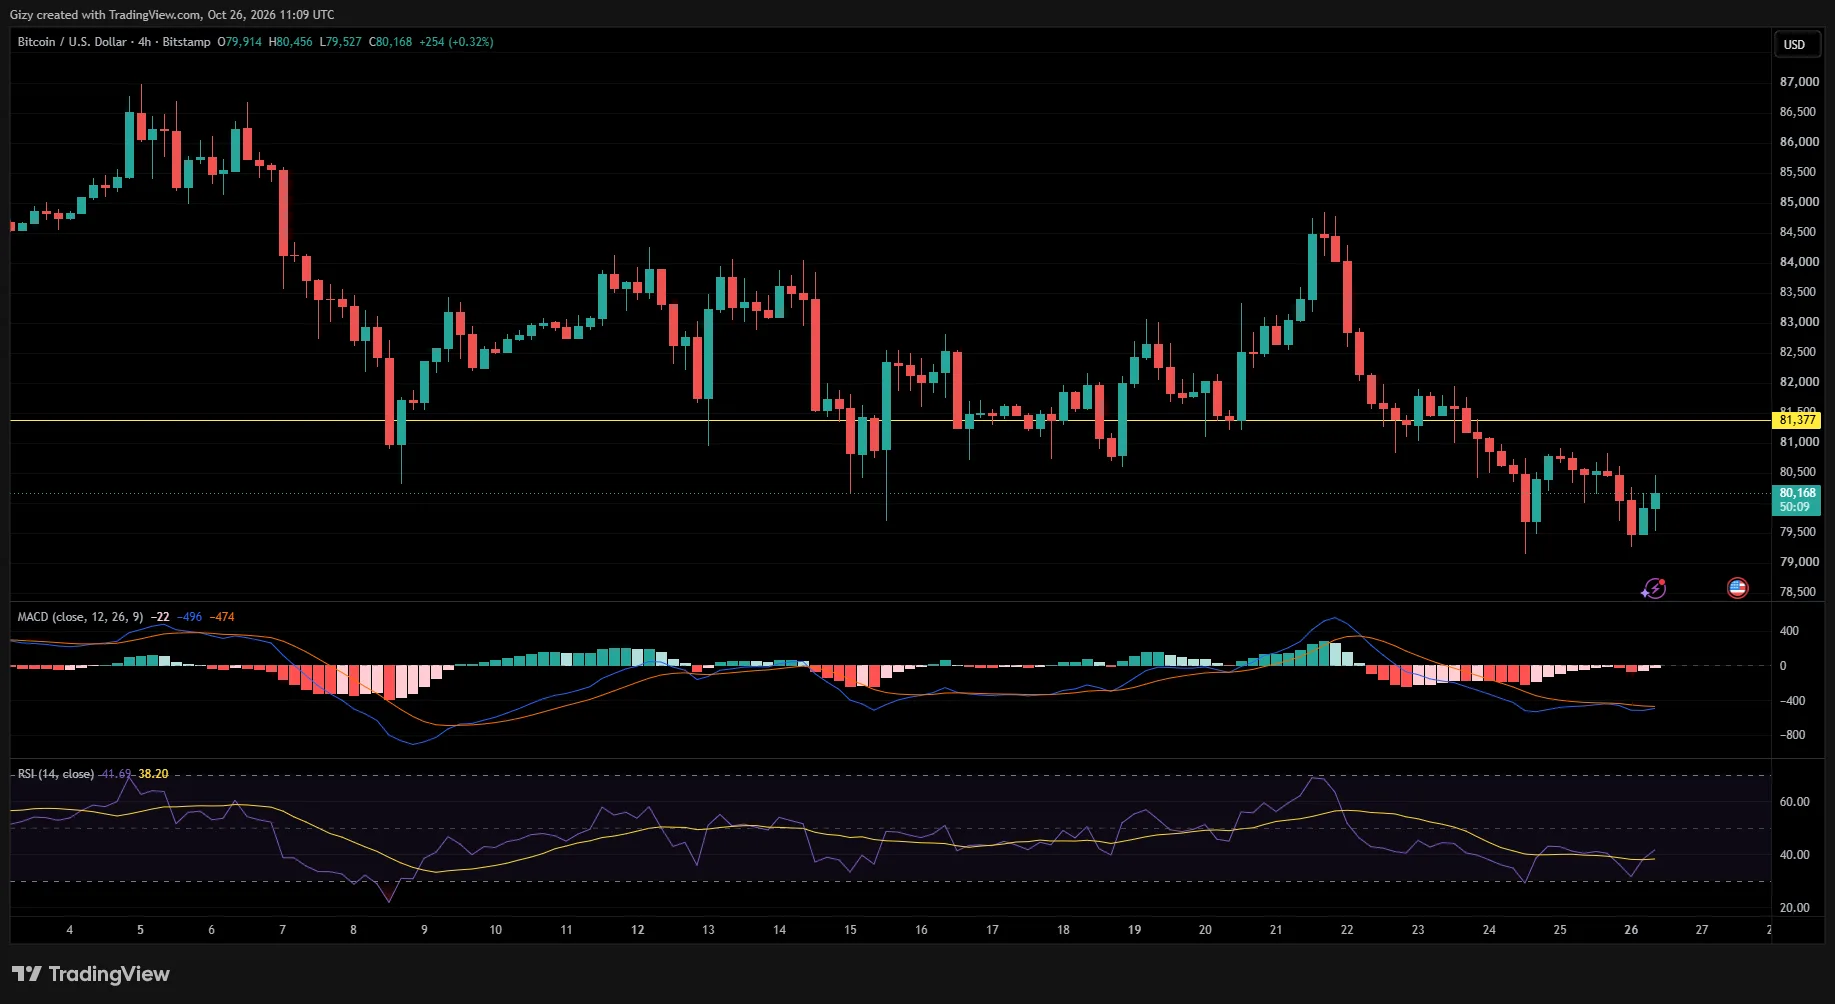
The bulls will look to reclaim $81K within the next two days. They may begin by attempting to erase Sunday’s losses and recover some of the ground lost last week.
Interestingly, technical indicators are looking bullish on the 4-hour chart. Following the earlier dip, the apex coin posted a green candle, and the current candle is also green. Although no clear candlestick pattern has emerged, the rebound aligns with several other indicators.
One such indicator is the Relative Strength Index (RSI), which dropped to 31 at the height of the selloff. Having approached oversold territory, the metric suggests that BTC could experience further gains in the coming hours.
Another positive signal comes from the Moving Average Convergence Divergence (MACD). The indicator is approaching a bullish crossover at the time of writing, supporting the possibility of a surge toward $81K.
ETH/USD
On the 4-hour chart, a potentially concerning candlestick pattern is forming. Following the previous green candle, ETH is printing what appears to be a hammer. If the session closes with this pattern, it could signal further downside in the coming hours. If prices follow this scenario, ETH could slip to $2,250.
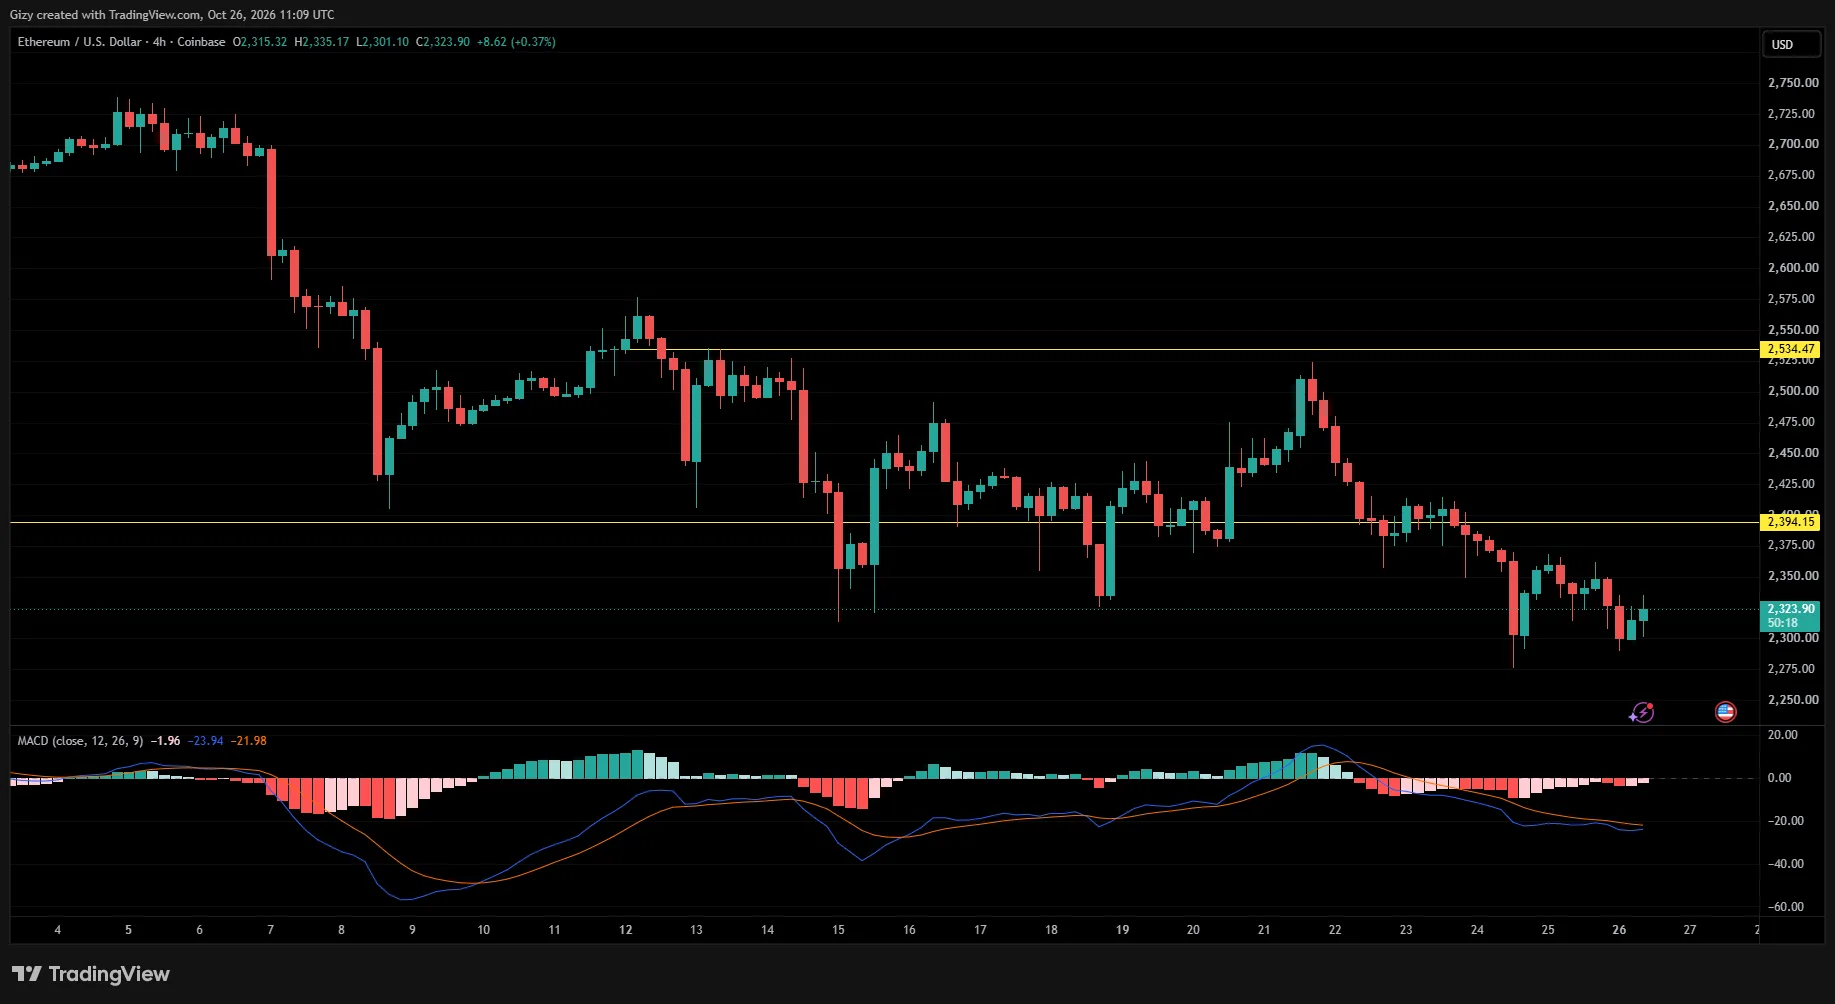
Conversely, other indicators suggest that such a decline may be less likely. The Moving Average Convergence Divergence (MACD) is currently generating a buy signal, with both EMAs approaching a crossover that could herald a further uptick.
Despite these bullish signals, selling pressure is gradually building around $2,360. A move toward $2,400 hinges on decisively reclaiming this level.
On a broader scale, the bulls will look to end the four-day streak of consecutive declines.
BNB/USD
BNB is currently printing a doji on the 1-day chart, while the 4-hour timeframe shows signs of a potential recovery.
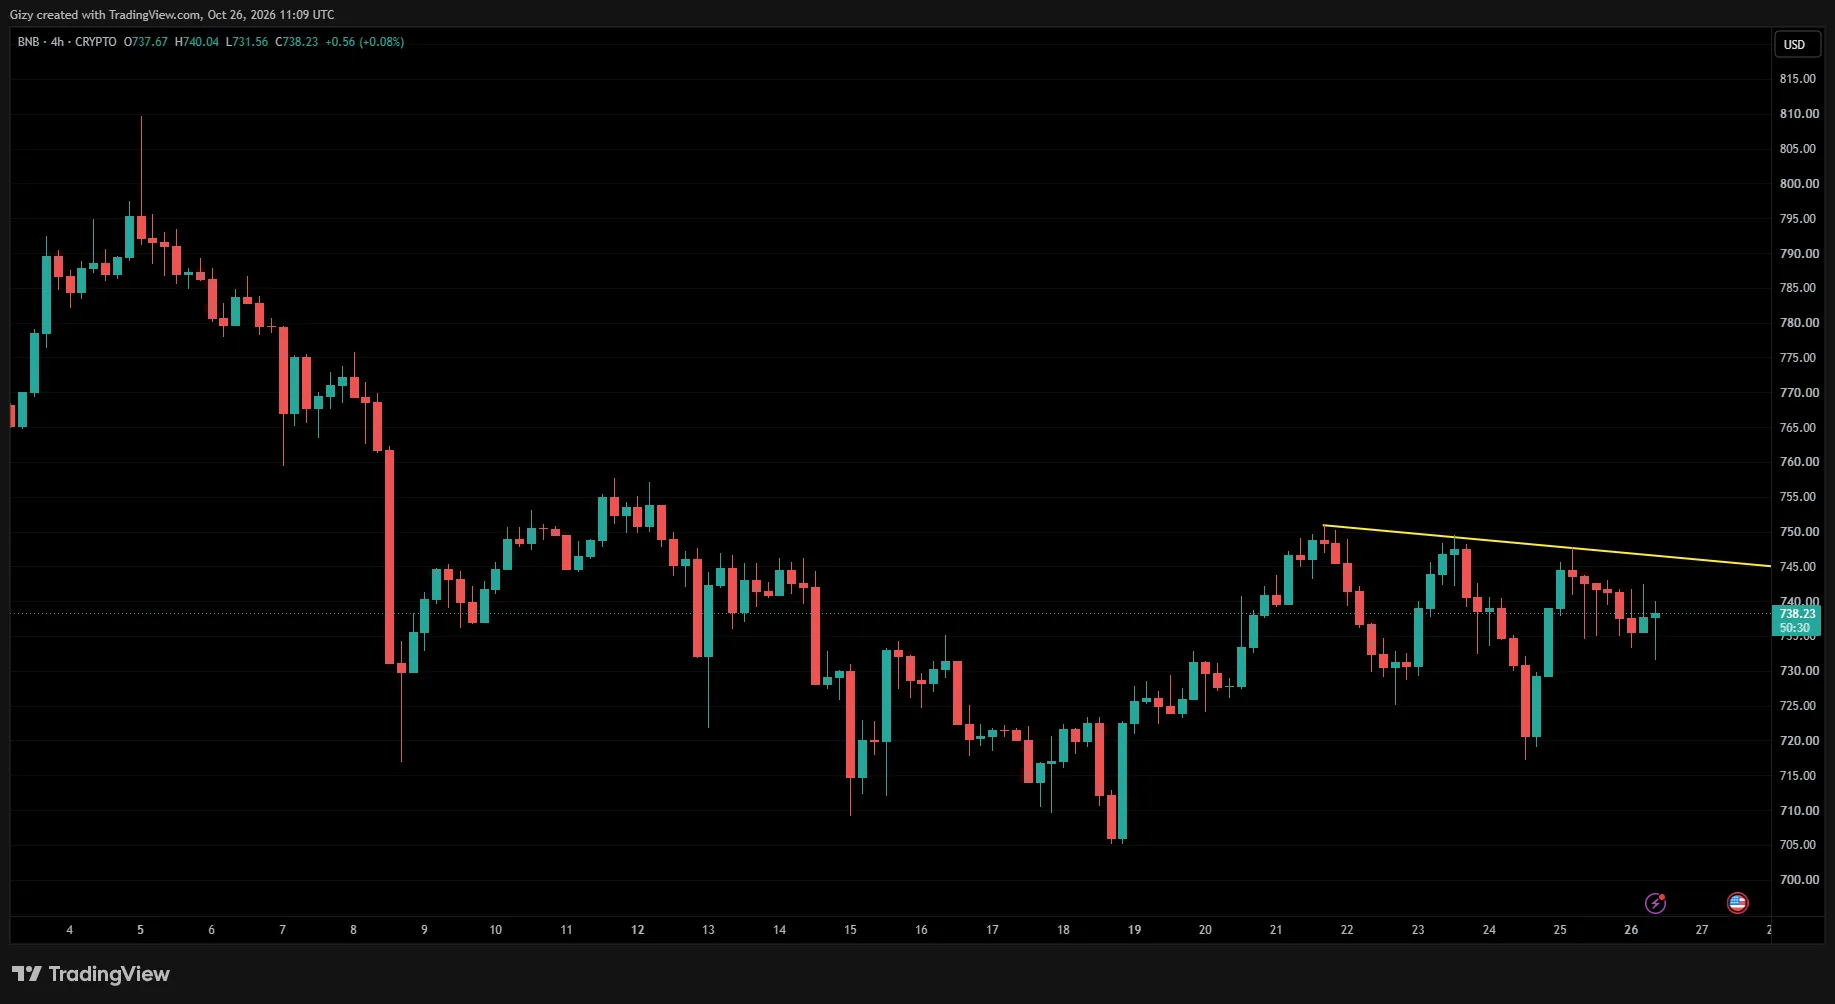
Although the current price action is worth watching, a broader pattern has emerged that could influence the asset’s next move. Since October 21, BNB has recorded a series of lower highs, as shown on the chart above.
If the bulls sustain the upward momentum, the next target could be around $745.
However, if they fail to decisively reclaim this level, another correction could follow, potentially pushing prices below $720 within the next two days. Conversely, a breakout above $745 could open the door to a retest of the $750 resistance.
XRP/USD
XRP has reversed Monday’s losses, turning green on the 1-day chart. However, the 4-hour timeframe suggests that the asset is not yet out of the woods. Instead, it is approaching a critical juncture.
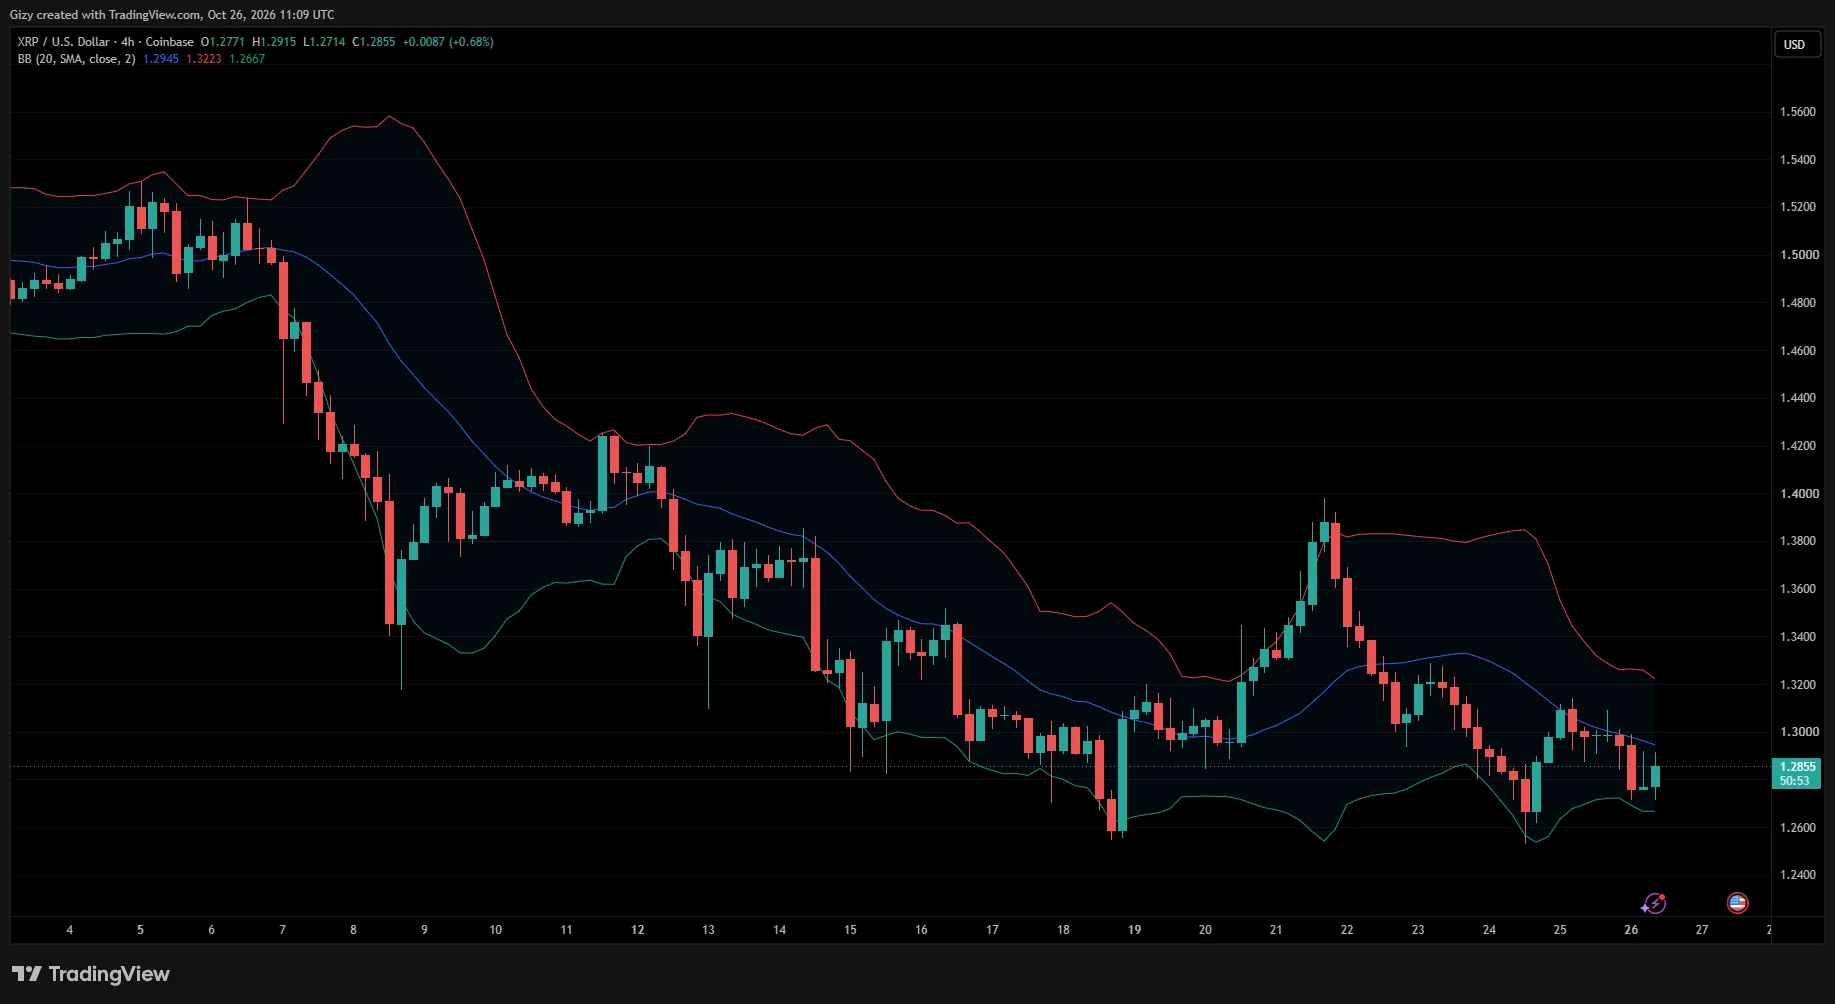
The altcoin traded below the middle Bollinger Band for most of the weekend. Interestingly, several attempts to break above this indicator failed, and XRP is now approaching another critical retest. Its upward momentum is slowing, suggesting an increased risk of another failed attempt.
If market conditions improve and XRP reclaims the middle band, its next target could be the upper band at $1.32. However, another rejection could push the asset below $1.26 by Wednesday.
SOL/USD
SOL is experiencing a trend similar to XRP. It has also traded below the middle Bollinger Band since October 22 but is showing signs of a potential breakout in the coming hours.
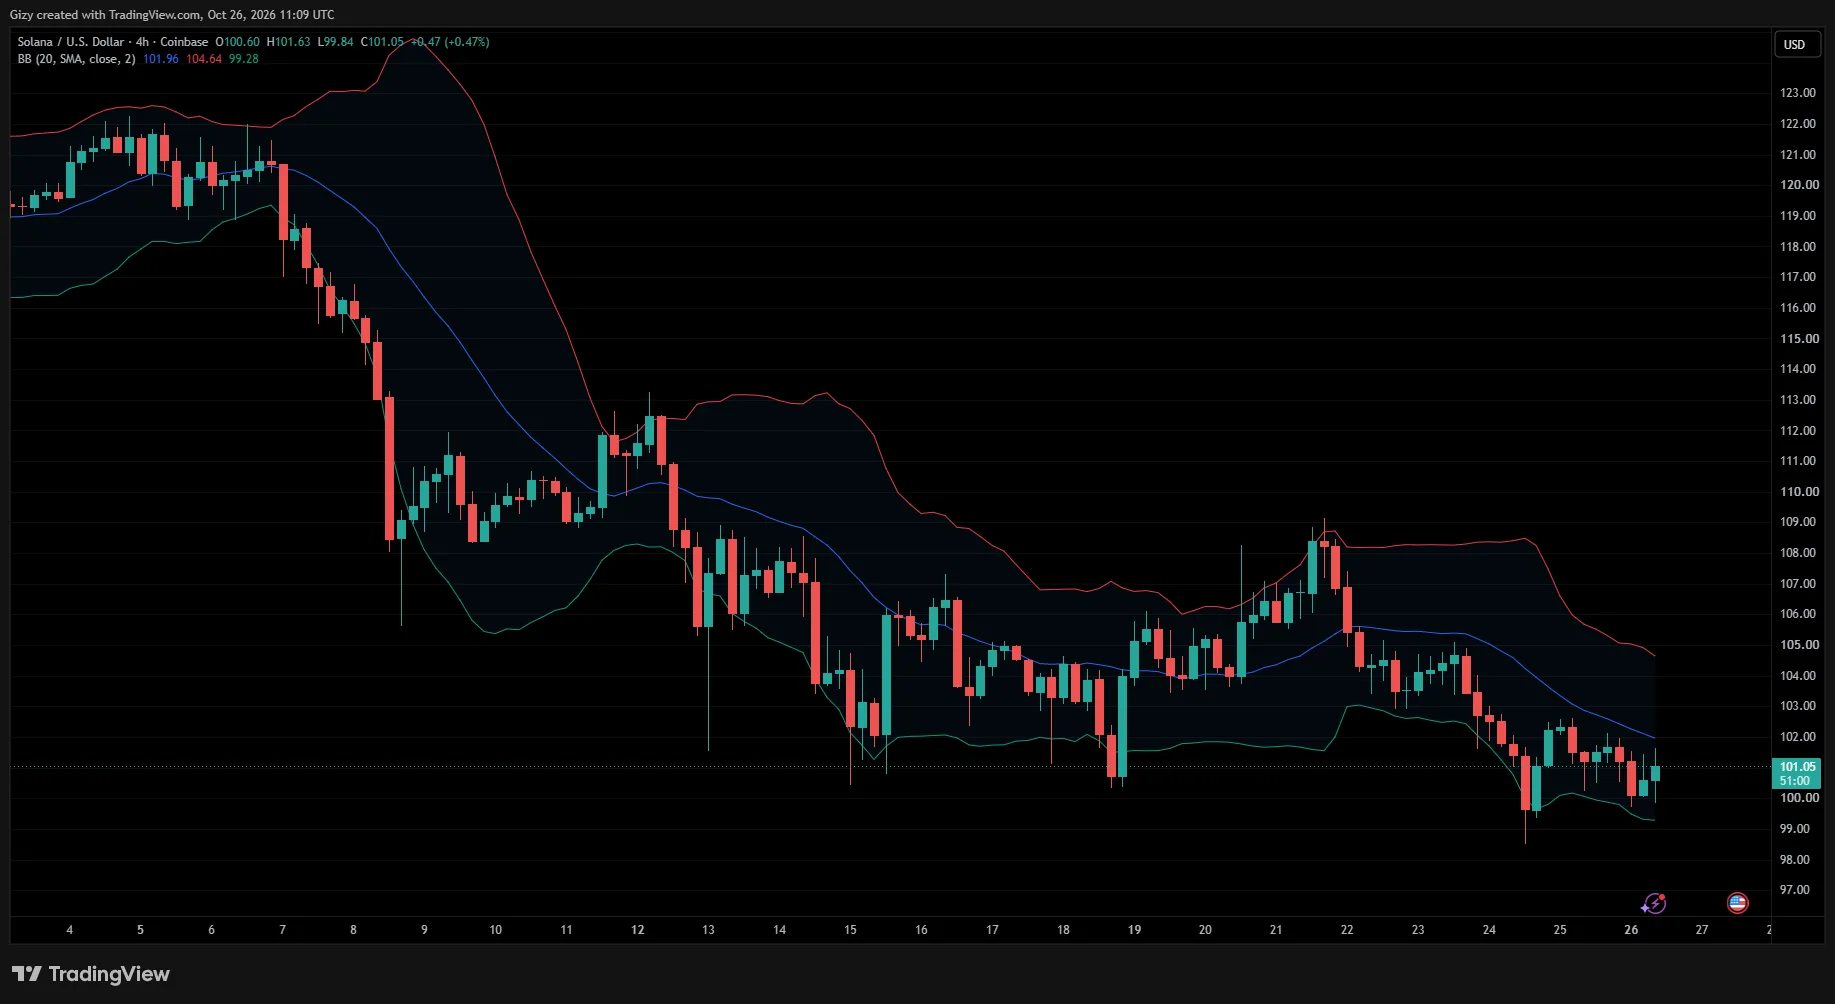
The asset is approaching a critical retest, and its current momentum suggests that buying pressure may be improving. However, previous price action points to growing selling pressure around $102.
Breaking above this resistance could result in a move above the middle Bollinger Band and potentially open the door to a retest of $105.
Meanwhile, the risk of rejection at $102 remains notable. If that happens, SOL could slip below $98 within the next two days.
On the 1-day chart, indicators remain bearish following the slight losses recorded over the past four days.
ZEC/USD
Zcash (ZEC) turned green on the 1-day chart after retracing earlier on Monday. Interestingly, it has closed the last two days slightly higher than its opening price while holding key support, much like XRP. It could be on course for a similar close on Monday.
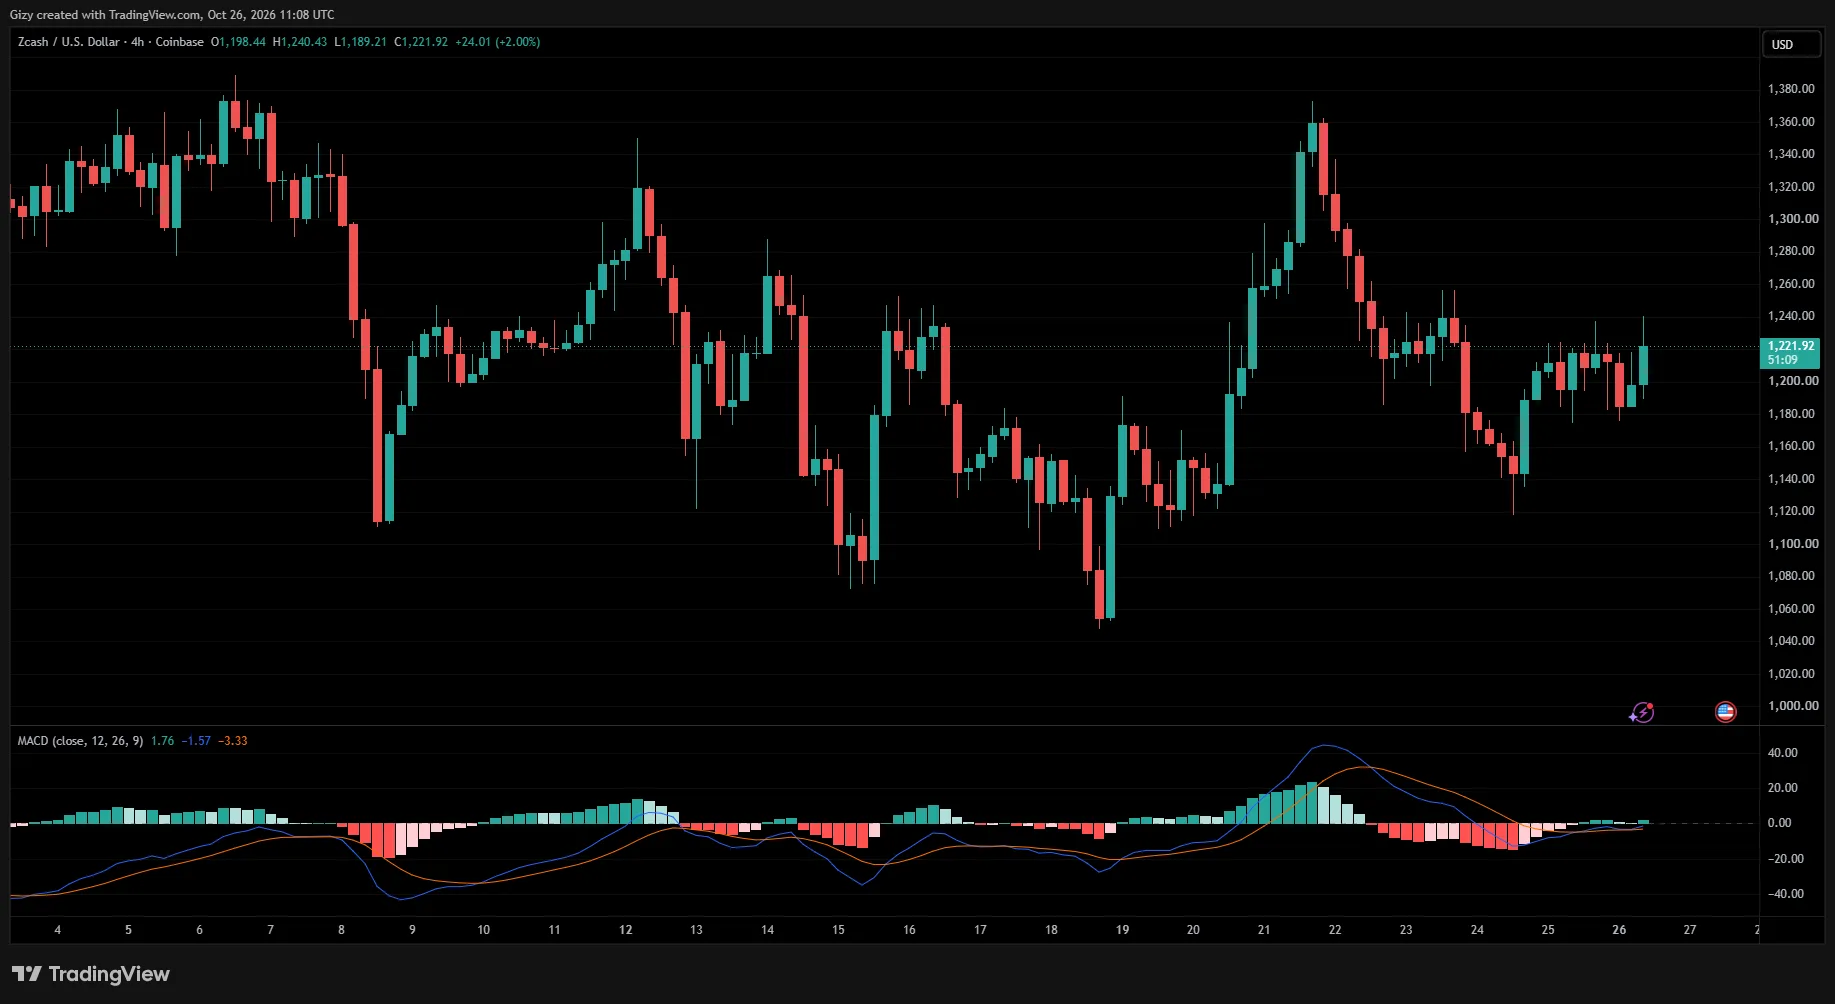
The 4-hour chart also points to a higher probability of this scenario playing out, as the altcoin recently broke above a selling zone. The next candle will be worth watching. If it closes above $1,225, ZEC could retest its three-day high.
However, a move above $1,300 would depend on a decisive breakout above that three-day high.
The post Price Prediction 10/26: BTC, ETH, BNB, XRP, SOL, ZEC appeared first on CoinTab News.
0
0


 Manage all your crypto, NFT and DeFi from one place
Securely connect the portfolio you’re using to start.
 Where will Bitcoin trade next?
Live Polymarket and Kalshi odds on Bitcoin price targets, compared side by side.
See Bitcoin price odds


