
XRP Holds Near $0.96 After Losing $1 as Charts Eye $0.89 Retest

0
0
BitcoinWorld
XRP Holds Near $0.96 After Losing $1 as Charts Eye $0.89 Retest
XRP was trading near $0.95 on Tuesday after losing both the $1 level and its August support base, leaving the token beneath the zone that once preceded a sharp rally, according to a technical analysis published by Cryptopotato.
Key facts
- XRP broke below the psychological $1 level and its August support base, with the report putting the current price near $0.95.
- Selling accelerated through the $0.985 to $1.035 demand area after XRP was rejected from the $1.20 to $1.34 supply zone, carrying the price toward $0.89.
- The daily RSI sits near 26, showing oversold conditions even after recovering from its latest trough.
- On the four-hour chart, XRP is consolidating between roughly $0.94 and $0.97, with the four-hour RSI back near 41.
- The $0.985 to $1.035 zone is now the main recovery hurdle, and a decisive break under the $0.89 low would extend the sequence of lower lows.
Inside the chart: broken support becomes resistance
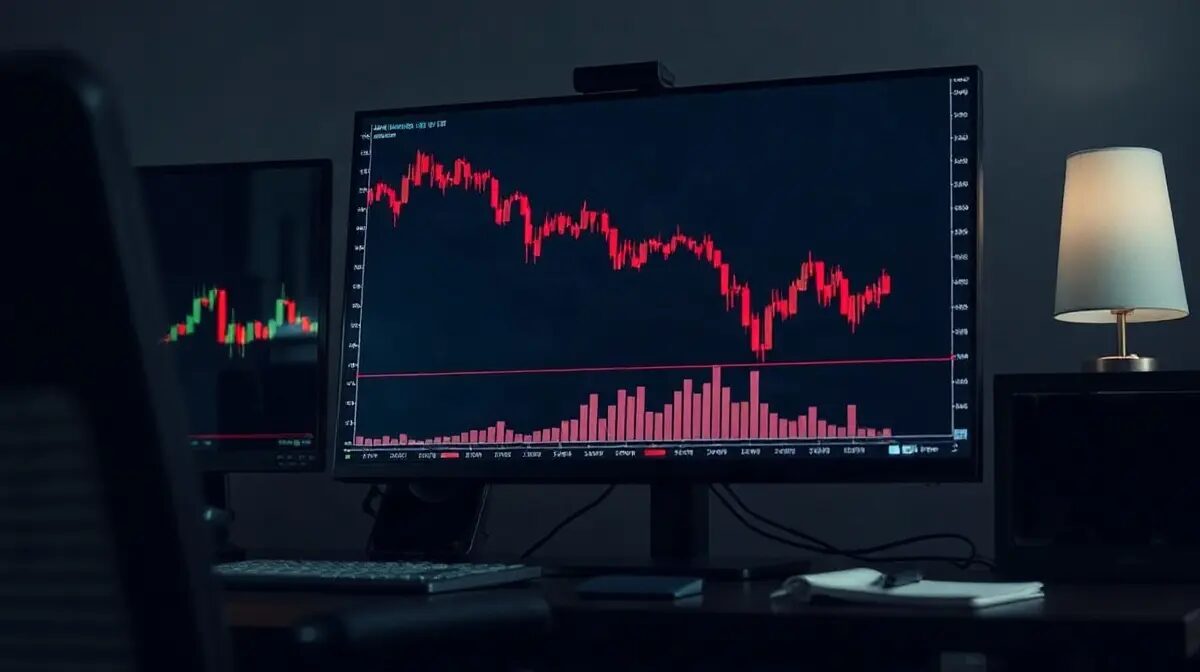
The daily picture shows a sustained decline after XRP was rejected from the $1.20 to $1.34 main supply zone. The drop through the $0.985 to $1.035 demand area erased the base that had preceded August’s sharp rally, and the rebound since has lifted the price only back to about $0.95, still under former support.
That matters because old support now acts as a ceiling. The $0.985 to $1.035 band is reinforced by the psychological $1 figure, and a rejection there would keep the bearish structure intact and leave the recent $0.89 low exposed. Buyers, in the report’s framing, need a sustained reclaim of the broken zone to show demand is returning.
The momentum readings add nuance rather than comfort. A daily RSI near 26 allows room for a corrective bounce, but on its own does not confirm a trend reversal. On the four-hour timeframe, the candles have narrowed into a $0.94 to $0.97 range after the sharp rebound from about $0.89, suggesting the first selling impulse has slowed without producing a meaningful bullish shift.
The four-hour RSI near 41 reflects improving momentum that is still below the neutral midpoint. Before challenging the $0.985 to $1.035 resistance, buyers would first need to clear local highs around $0.97 to $0.98. A sustained move through that ceiling would weaken the immediate bearish continuation setup and could open a recovery toward the previous $1.06 to $1.10 consolidation, with the $1.20 to $1.34 supply zone remaining the main structural barrier farther up.
Failure to recover, according to the analysis, keeps the sideways action best read as a pause inside a downtrend rather than a bottom. A breakdown beneath the $0.94 consolidation would raise the risk of a return to $0.91 and then the $0.89 low, and a decisive break beneath that low would extend the run of lower lows with no clearly marked demand zone below it on the supplied chart.
Market snapshot
XRP changed hands at $0.9623 (₹89.95) at the 17 November 2026 20:30 UTC snapshot, up 0.7% over 24 hours but down 9.3% over seven days, with a market cap of $61.12 billion and $1.12 billion in 24-hour volume, per CoinPaprika data. Bitcoin traded at $63,713 (₹5,955,161), down 2.0% on the day and 13.7% on the week.
Why it matters
XRP trades well below the heights many holders anchored on during August’s rally, and the levels in this report give short-term traders a clear framework: $0.985 to $1.035 as the line between stabilization and continuation, $0.89 as the floor to defend. Losing the $1 handle is also a psychological marker that tends to draw retail attention and can feed momentum in either direction.
The week’s decline of 9.3% in XRP has coincided with a softer Bitcoin tape, which in past cycles has pulled large-cap altcoins lower even when their own news flow was neutral. That context sits alongside separate pressure from holders: our earlier reporting covered XRP holders demanding Ripple burn 31.1 billion tokens by March 2027, a reminder that supply expectations are part of how investors are framing the token right now.
None of this changes the fundamental point from the chart review: the bounce from $0.89 has not yet repaired the damage from the loss of $1, so calls of a trend reversal are premature until buyers prove themselves at the broken support.
What to watch
The next concrete signal is whether XRP can close a daily candle inside the $0.985 to $1.035 zone, or fails again at the $0.97 to $0.98 local highs. A break of the $0.94 consolidation floor, or of the $0.89 low, would shift focus to how far the next leg extends.
Frequently Asked Questions
Why did XRP fall below $1?
CryptoPotato’s analysis attributes the decline to XRP’s rejection from the $1.20 to $1.34 supply zone, with selling accelerating through the $0.985 to $1.035 demand area and erasing the base that preceded August’s rally.
What price levels matter most for XRP right now?
The $0.985 to $1.035 zone is the key recovery hurdle, reinforced by the psychological $1 level. On the downside, $0.94 is the current consolidation floor, with $0.91 and the $0.89 low below it.
Does an oversold RSI mean XRP has bottomed?
Not necessarily. The daily RSI near 26 signals oversold conditions and allows room for a corrective bounce, but CryptoPotato notes it does not confirm a trend reversal without a reclaim of broken support.
What would confirm a shift away from the bearish setup?
A sustained move above the $0.94 to $0.97 consolidation and then through the $0.985 to $1.035 resistance zone, which could open a recovery toward the prior $1.06 to $1.10 consolidation.
This post XRP Holds Near $0.96 After Losing $1 as Charts Eye $0.89 Retest first appeared on BitcoinWorld.
0
0

 Manage all your crypto, NFT and DeFi from one place
Securely connect the portfolio you’re using to start.


