
3 Altcoins Ready to Break Out This Week: XRP, Quant and Injective

0
0
XRP is back in focus this week. The token trades near $1.51 after it moved above a falling trendline on the four-hour chart.
Analyst Ali Charts named three altcoins to watch: XRP, Quant (QNT), and Injective (INJ).
Each coin has a different setup. The first is consolidating below a major resistance zone. QNT is cooling after a sharp rally. INJ is building a higher-low structure.
Here is a simple look at all three.
What Is the XRP Price Today?
The token is around $1.51. On the four-hour chart, price pushed above the top line of a triangle that held it down for several days.
Ali Charts says that if $1.50 holds as support, he is watching a move toward $1.62. That is about 7% above today's price.
A drop under $1.50 would weaken the breakout.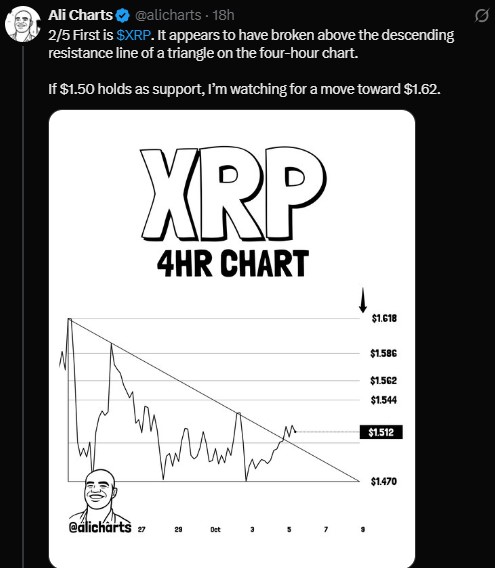
What Are the Key XRP Support and Resistance Levels?
These levels are marked on the four-hour chart:
Level | Type | What It Means |
$1.618 | Resistance | Top of the recent range |
$1.586 | Resistance | Mid-range barrier |
$1.562 | Resistance | First area where sellers may show up |
$1.544 | Resistance | Near-term hurdle |
$1.512 | Current price | Just above the broken trendline |
$1.470 | Support | Recent low bulls need to defend |
A move below $1.47 would put the whole setup in doubt.
What Is the Cup and Handle Pattern?
A cup and handle is a bullish shape. It has a rounded bottom, then a small pause called the handle.
One analyst says the cup began in January near $1.60. The token fell for months, then climbed back to the $1.61 to $1.70 range in September.
Now price sits near $1.50 under that same zone. In this view, that is the handle.
A move above $1.70 could open the way to $1.80, then $2.00 or more. Nothing is guaranteed.
Can XRP Reach $2.16?
Veteran trader Peter Brandt drew attention on October 5, 2026. He sees a possible cup and handle with a measured target near $2.16.
That number is the height of the pattern, based on daily closing prices, projected upward. It sits roughly 43% above the current price.
On a larger time frame, he thinks the shape might be the right shoulder of an inverted head and shoulders.
He is careful about it. In his words, targets are not sacred, and charts often turn into something else.
Three things matter most in the short run:
Whether $1.50 stays firm as support
A push through $1.562 and $1.618
A daily close above $1.70
What Is Overhead Supply and Why Is It Bad?
Overhead supply means many holders bought at higher prices. When price climbs back to those levels, some may sell to break even.
Brandt calls this a negative for the token. He also calls the right shoulder poorly formed and short, so it may need more time.
Supply between $1.60 and $2.00 could slow any rally. The $2.16 target needs much more work.
What Is the Quant (QNT) Price Prediction This Week?
Quant has already had a strong month. The question now is whether it can extend those gains.
Ali Charts says an hourly close above $262 would confirm the breakout he is watching. That would put $315, then $344, in focus.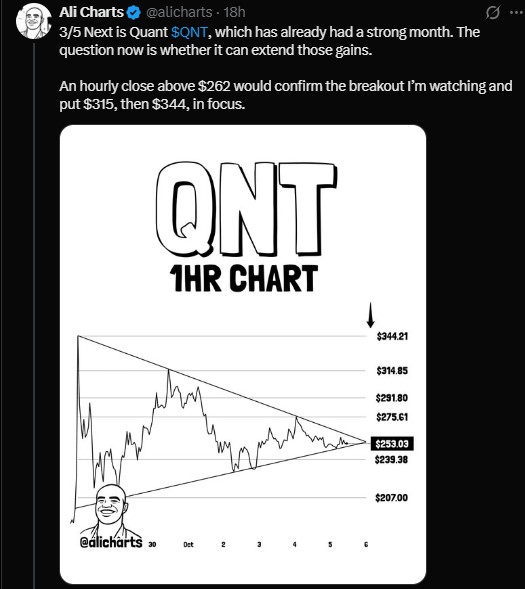
A separate four-hour view shows QNT inside a symmetrical triangle. Price is near $257.6, just above the 20-EMA at $256.95. The 50-EMA near $238.6 gives stronger support.
If QNT closes a four-hour candle above the descending trendline around $265 to $270, it could move toward $280 to $300. A stronger breakout may aim for $315 to $325.
A decisive break below $250 to $245 would cancel the bullish setup. Price could then slide toward $238 to $220.
A big move looks close. Above $270 is bullish, and below $245 is bearish.
Is Injective (INJ) Ready to Break Out?
Ali Charts says INJ appears to have broken out of a cup and handle. It is now retesting its neckline near $7.33.
If buyers defend that level and momentum picks up, the pattern points toward $13.40.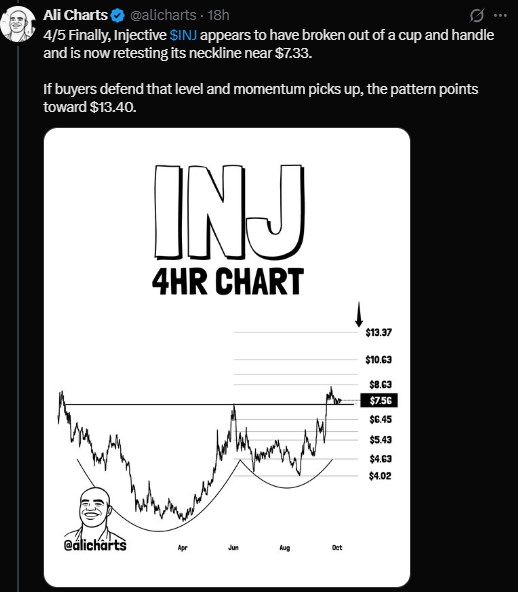
On the four-hour chart, price is moving around $7.50 to $7.60 inside a wide descending channel. The 20 and 50 EMAs sit close to $7.56. The 100 EMA near $7.39 acts as support.
If INJ holds $7.35 to $7.40 and breaks above $7.65 to $7.70, it could move toward $7.90 to $8.10. Then $8.30 to $8.40 is possible if momentum grows.
A four-hour close below $7.35 would weaken the structure. Price could drop toward $7.10 to $7.00.
For now, the near-term bias is neutral to bullish. The key breakout zone is $7.65 to $7.70.
Which Altcoin Has the Strongest Breakout Setup?
Coin | Current Zone | Bullish Trigger | Upside Targets | Risk Level |
XRP | $1.51 | Hold $1.50 | $1.62, $1.70, $2.16 | Below $1.47 |
QNT | $257.6 | Close above $262 | $315, $344 | Below $245 |
INJ | $7.50 to $7.60 | Hold $7.33 to $7.40 | $8.10, $13.40 | Below $7.35 |
What Happens Next for These Three Altcoins?
The setups look different, but all three coins sit near key levels. A clean break or a failed retest could decide the next move.
For the first coin, $1.50 is the line to watch. For QNT, it is $262. For INJ, it is the $7.33 to $7.40 area.
Traders also tend to wait for a strong close before they trust a breakout. Charts can change fast.
Disclaimer
This article is for information only. It is not financial, investment or trading advice. Crypto prices are volatile, and you can lose money. Price targets are not guaranteed. Do your own research and speak with a licensed financial advisor before you invest.
0
0


 Manage all your crypto, NFT and DeFi from one place
Securely connect the portfolio you’re using to start.


