
XRP Bulls Must Defend $1.20 After $6.3B Binance Hack Rocks Crypto

0
0

XRP is trading near $1.252, down 2.8% on the day, after a security scare at Binance shook the wider crypto market. Binance said a compromised engineer's laptop led to unauthorized withdrawals worth around $6.3 billion.
About $3 billion has been frozen so far. Binance says it will cover the losses, and withdrawals are paused while security checks finish.
The selloff was quick, but not wild. From just before the news on Thursday evening to the lows, Bitcoin fell about 5.5%, Ethereum about 7.0%, and the token about 6.5%.
Bitcoin touched roughly $76,320 and has since bounced back near $78.4K.
Fear Index Crashes to 30 From 51 in One Day: What It Signals
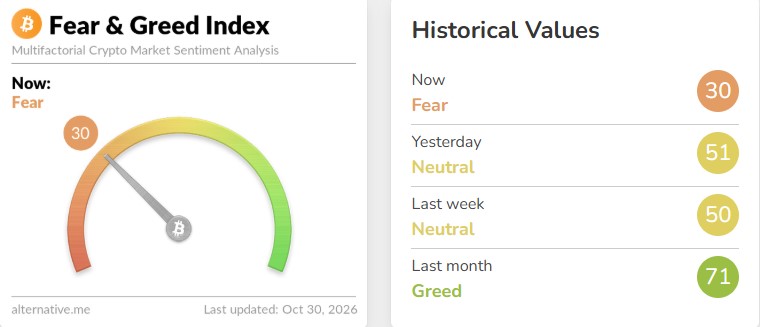
The Crypto Fear & Greed Index now reads 30, which is "Fear." It was 51 yesterday and 50 last week. A month ago it sat at 71, in "Greed."
That is a sharp mood change. Headlines like this often create noise first. What happens next depends on what Binance reveals in the coming days.
Time Frame | Index Reading | Mood |
Now | 30 | Fear |
Yesterday | 51 | Neutral |
Last week | 50 | Neutral |
Last month | 71 | Greed |
Bear's Eye $1.14 as a Key Fibonacci Floor Cracks
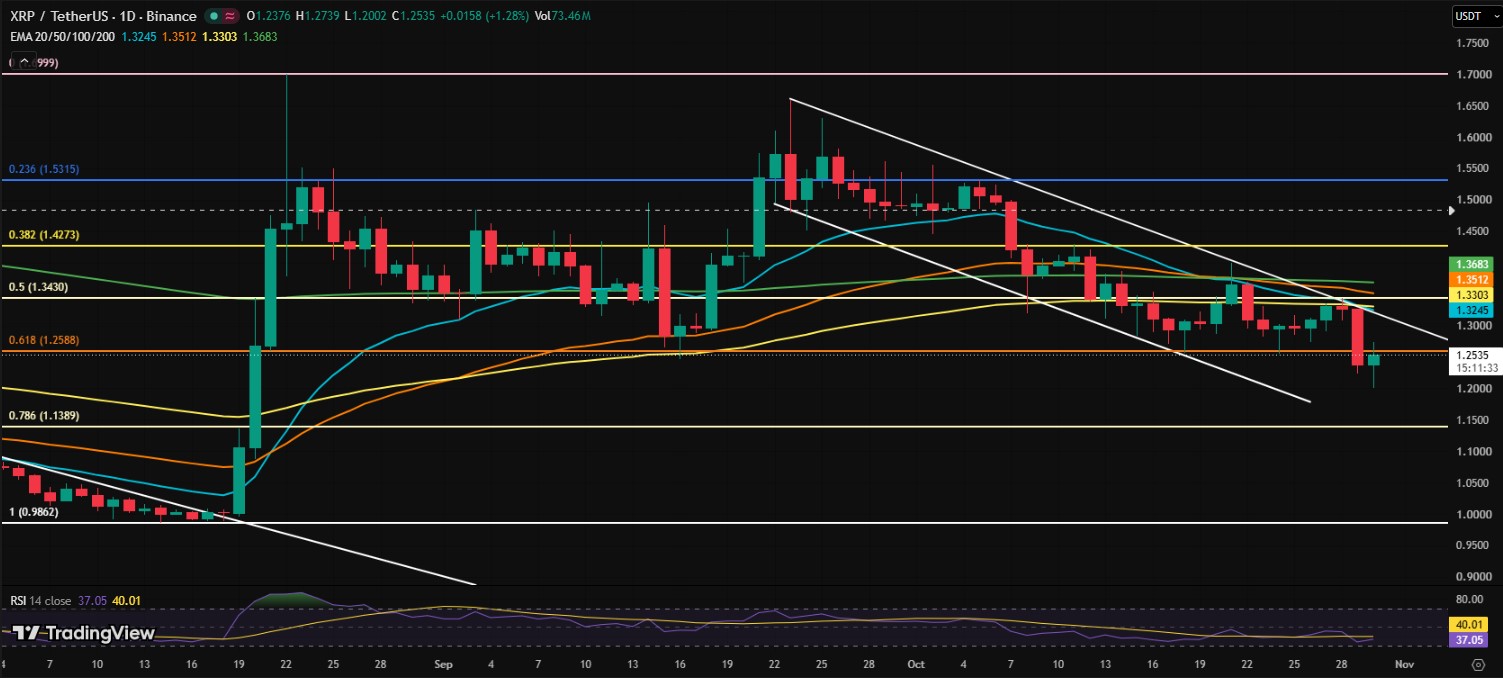
On the daily chart, the token sits inside a descending channel with lower highs and lower lows. Price is below the 20-, 50-, 100-, and 200-day EMAs.
It also slipped under the 0.618 Fibonacci level at $1.2588. The daily low was $1.2002. The RSI is near 37, which points to weak momentum, though a short bounce can still happen.
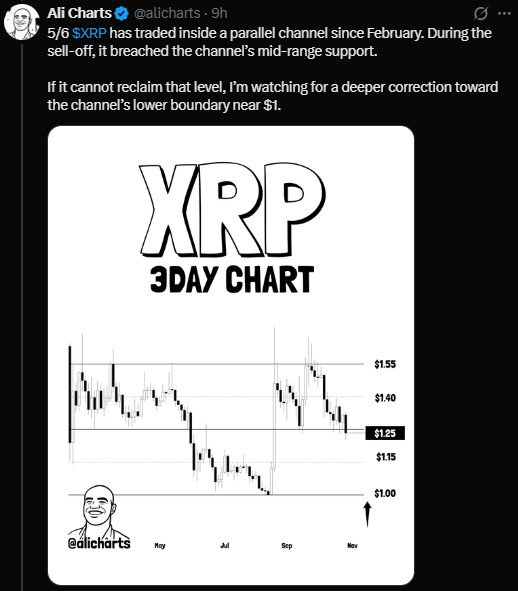
Analyst Ali Charts adds another view. He notes the price has moved inside a parallel channel since February and broke its mid-range support in the selloff. If it cannot take that level back, he is watching the lower boundary near $1.
Level | Price | What It Means |
Resistance | $1.4273 | Fibonacci 0.382 |
Resistance | $1.30 to $1.33 | Key zone to clear |
Resistance | $1.2588 | Fibonacci 0.618, lost on the break |
Current price | $1.2535 | Daily close area |
Support | $1.20 to $1.18 | First support zone |
Support | $1.1389 | Fibonacci 0.786 |
Support | $1.00 | Channel low in Ali Charts view |
Longs Wiped Out: $36.5M Liquidated While Shorts Barely Flinch
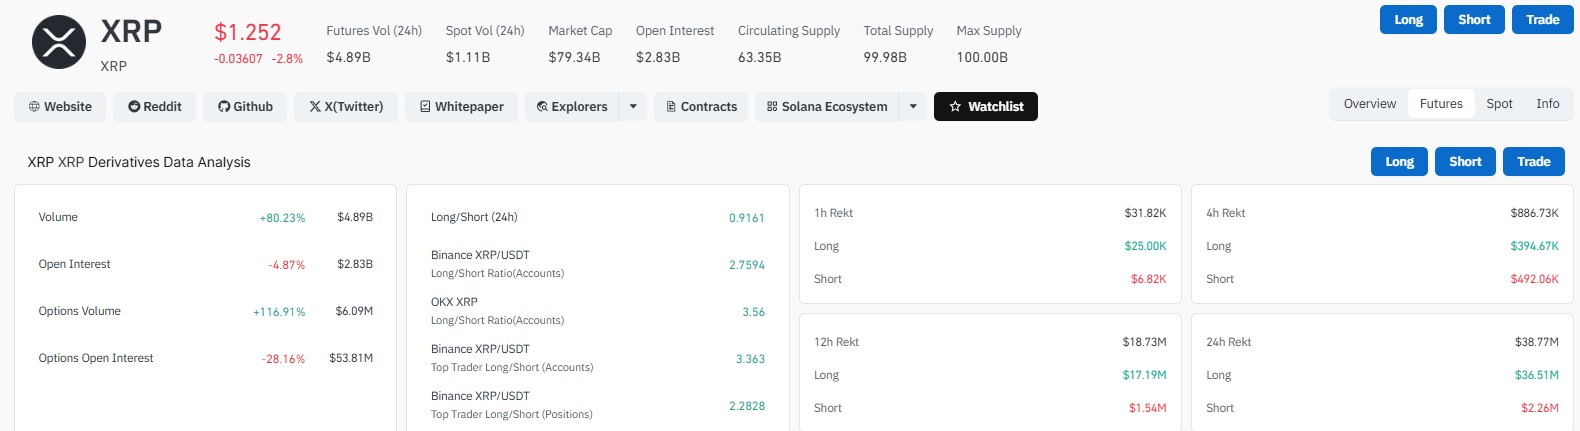
Futures volume jumped 80.23% to $4.89 billion. Open interest fell 4.87% to $2.83 billion, so some traders are closing positions.
Liquidations reached $38.77 million in 24 hours. Of that, $36.51 million came from longs and only $2.26 million from shorts.
The overall long/short ratio is 0.9161, a slight lean to shorts. Big accounts look more bullish. Binance top traders show a 3.363 ratio by accounts and 2.2828 by positions.
Derivatives Metric | Reading |
Futures volume (24h) | $4.89B (+80.23%) |
Open interest | $2.83B (-4.87%) |
Options volume | $6.09M (+116.91%) |
Options open interest | $53.81M (-28.16%) |
Long/short ratio (24h) | 0.9161 |
Total liquidations (24h) | $38.77M |
$1.81B ETF Inflows: Strong Floor or False Comfort?
Spot ETFs tied to the coin pulled in $8.43 million on October 29. Cumulative net inflows now stand at $1.81 billion.
Total net assets are about $1.47 billion, or 1.87% of the market cap. Every listed fund fell 3.94% to 4.22% on the day, yet money still came in.
Sponsor | Net Assets | Daily Inflow | Daily Change |
Bitwise | $533.49M | $2.86M | -4.22% |
Franklin | $398.11M | $5.57M | -3.94% |
Canary | $312.26M | $0 | -3.97% |
21Shares | $137.62M | $0 | -4.01% |
Grayscale | $83.80M | $0 | -3.99% |
Steady inflows can support the longer-term story. They do not promise a quick recovery.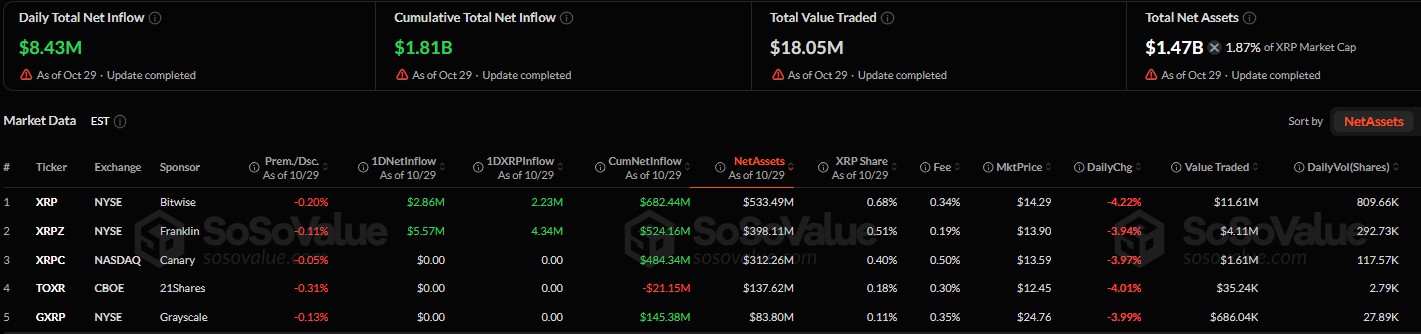
Bull, Bear or Sideways? The $1.20 and $1.33 Lines That Decide It
For buyers, the first job is to win back $1.2588. After that, a break above $1.30 to $1.33 would matter most. If XRP hold above $1.33 could open a path to $1.4273.
For sellers, a loss of $1.20 could speed things up. The next targets are $1.18 and then $1.1389.
Scenario | Trigger | Possible Target |
Bullish | Reclaim $1.2588, then clear $1.33 | $1.4273 |
Neutral | Range between $1.20 and $1.2588 | Sideways |
Bearish | Close below $1.20 | $1.18, then $1.1389 |
The $13 Chatter and Lazarus Rumor: Fact vs. Noise
Some social media voices still talk about $13, citing a long-term 3-week chart with a $13.68 mark. That is one trader's view. Nothing in the daily data above supports it right now.
The same posts mention claims that North Korea's Lazarus Group was behind the Binance breach. That is an allegation, not a confirmed finding.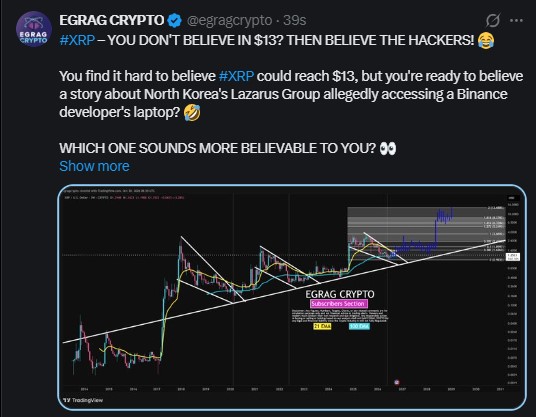
Watch Binance updates, the $1.20 zone, and ETF flow data in the days ahead.
Disclaimer
This article is for information only and is not financial, investment or trading advice. Crypto assets are volatile and carry a high risk of loss. Prices and data can change fast. Do your own research and speak with a licensed financial adviser before making any decision. Never invest money you cannot afford to lose.
0
0

 Manage all your crypto, NFT and DeFi from one place
Securely connect the portfolio you’re using to start.


