
Hyperliquid Price Prediction: Will Exchanges Listings Lift HYPE Now?

0
0

Can HYPE hold support now that Korean traders have access? Two Korean exchanges started $HYPE trading on Nov 10, 2026, and the chart tests support.
This Hyperliquid price prediction covers Nov 10 to 17, 2026, UTC. $HYPE trades at $74.457 as of 08:16 UTC.
HYPE 24-Hour Price Snapshot: Market Data
CoinGecko market data ranks $HYPE 11 with a $17.84B market cap. FDV, short for fully diluted valuation, is price times total supply, so it shows value if every token is traded.
Metric | Value |
Price | $74.457 |
24-hour change | +2.6% |
24-hour range | $72.46 to $76.68 |
Market cap | $17.84B |
FDV | $70.907B |
24-hour volume | $1.227B |
Source: CoinGecko, HYPE market snapshot, captured Nov 10, 2026, 08:16 UTC
HYPE Upbit Listing and Bithumb Catalyst
A KRW market is a trading pair priced in Korean won. Per the official Upbit Korea X post, HYPE gets KRW, BTC, and USDT markets there.
Source: Upbit Korea official X post, captured November 10, 2026, 08:16 UTC
The $HYPE Upbit listing went live at 15:00 KST (06:00 UTC) on Nov 10, 2026. Bithumb followed with $HYPE/KRW at 4:00 PM KST (07:00 UTC), per its official X post.
Source: Bithumb official X post, captured November 10, 2026, 08:16
Trading started on both exchanges before this 08:16 UTC update, so $HYPE won pairs are live on two exchanges. KRW volume is the data to watch.
HYPE ETF Flows Show a $2.63M Outflow
A spot ETF is a fund that holds the token itself, and net assets is the value of those holdings. SoSoValue spot HYPE ETF data, as of Nov 9, 2026, UTC, shows a $2.63M net outflow for the day.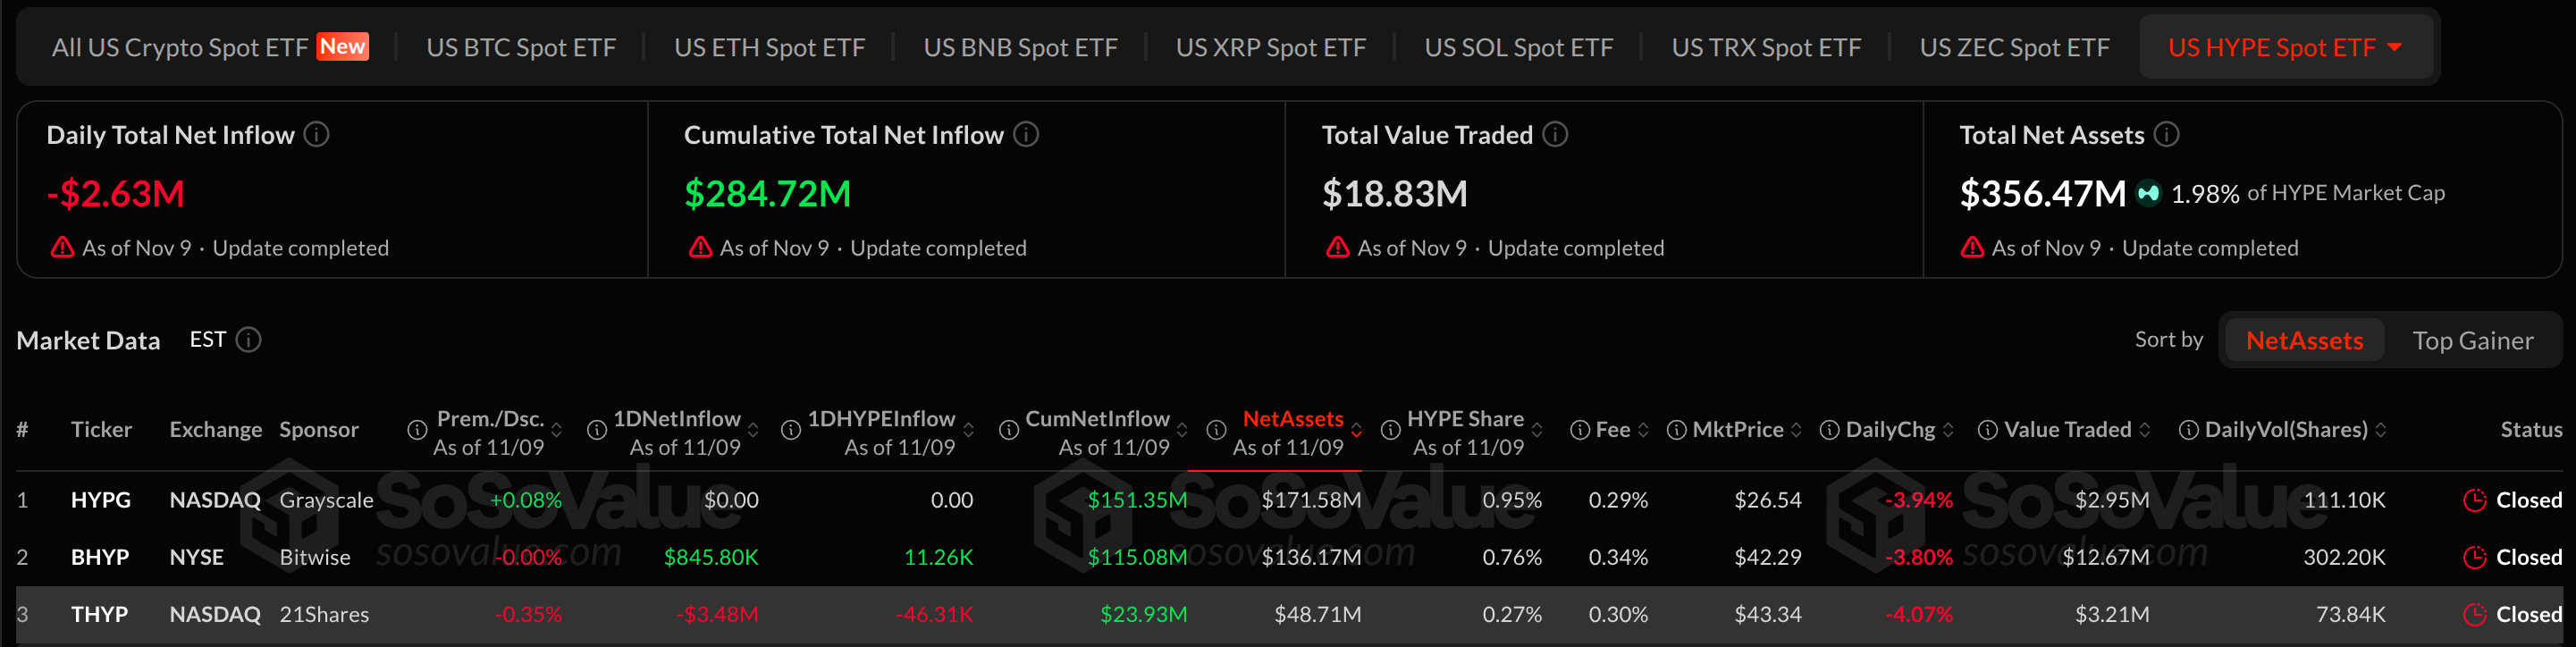
Source: SoSoValue, spot $HYPE ETF flows as of November 9, 2026, UTC, captured Nov 10, 2026, 08:16 UTC
Fund | 1-day net flow | Net assets |
HYPG (Grayscale) | $0.00 | $171.58M |
BHYP (Bitwise) | +$845.80K | $136.17M |
THYP (21Shares) | -$3.48M | $48.71M |
Is $2.63M a warning Against $356.47M in net assets, it's 0.74%. And SoSoValue puts fund holdings at 1.98% of $HYPE market cap, with cumulative inflow at $284.72M. For the rules angle, see the earlier regulatory shift analysis.
HYPE Open Interest and Futures Volume
Open interest is the total value of futures contracts still open. CoinGecko lists $HYPE open interest in perps at $3.567B as of 08:16 UTC on Nov 10, 2026.
Source: CoinGlass, $HYPE futures volume heatmap, 24-hour, captured November 10, 2026, 08:16
Per the CoinGlass heatmap, 24-hour $HYPE futures volume totals $2.06B. Binance recorded $578.85M of it, and Hyperliquid recorded $447.40M.
HYPE Price Forecast Catalysts and Risks
Dated catalysts for this Hyperliquid price prediction were the Upbit start at 06:00 UTC and the Bithumb start at 07:00 UTC on Nov 10, 2026.
HYPE Technical Analysis: 4-Hour Timeframe
Source: TradingView, HYPE/USDT 4-H, EMA 50, and RSI 14, November 10, 2026, 08:16 UTC
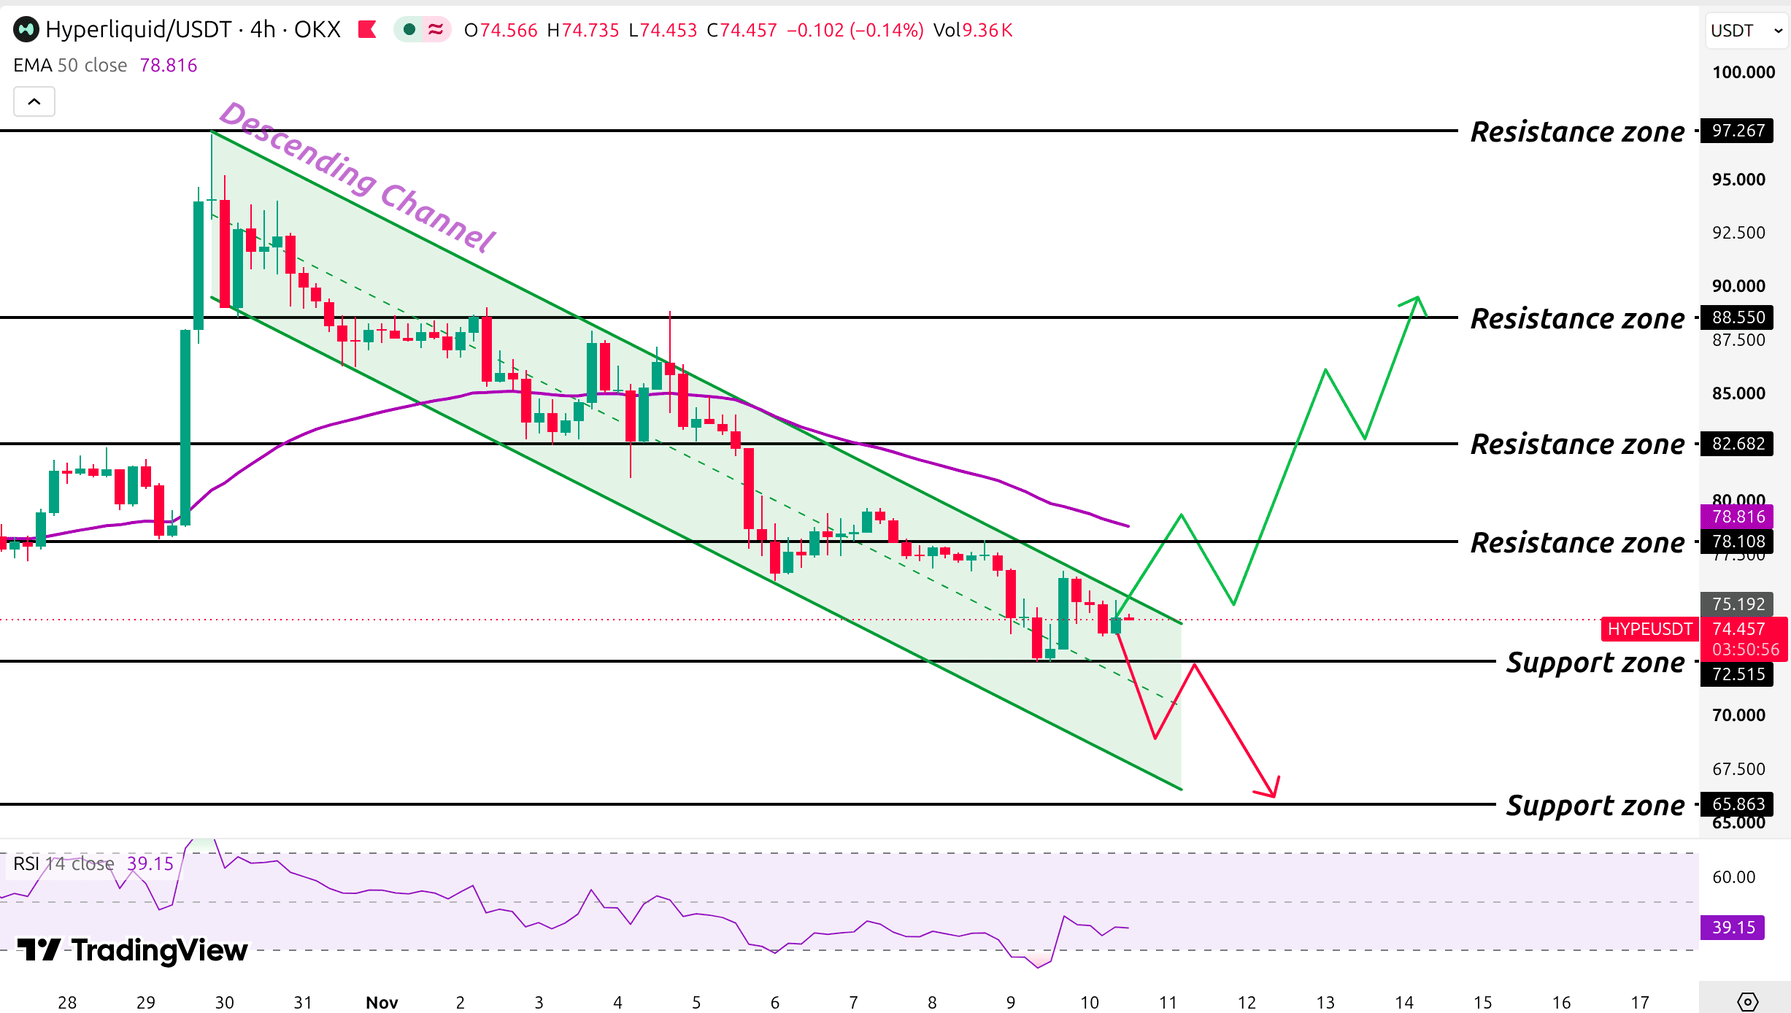
The OKX 4-hour chart for $HYPE/USDT on TradingView, captured Nov 10, 2026, 08:16, frames this Hyperliquid price prediction. A sharp October rally spiked to the $97.27 level before sellers took control.
After the spike, the price slid inside a descending channel, two falling parallel trendlines that hold the price between resistance and support. The market tried many times to break the channel trendline resistance, but sellers defended the trendline.
A sharp drop on November 5 sent the price through the 50 EMA and the $78.11 resistance zone. Buyers defended the $72.52 support zone, where buyers have stepped in, on November 9. Right now, $HYPE trades above $72.52 support, under the channel resistance and under the 4-hour 50 EMA.
The $HYPE 50 EMA on the 4-hour chart sits at $78.82, and HYPE's $74.457 price trades 5.5% below it. An EMA, short for exponential moving average, is a trend line that weights recent prices most. The latest 4-H candle trades below it, and the channel resistance sits near it, so a real recovery needs both levels to break.
The $HYPE RSI reads 39.15 on the 14-period setting. It topped 60 in the October 30 rally and dipped near 30 on November 9. Under 50, sellers hold the momentum edge, and above 30, oversold conditions haven't formed, so price has room to fall.
Hyperliquid Support Levels and Resistance Levels
Type | Level |
Resistance | $97.26 |
Resistance | $88.55 |
Resistance | $82.68 |
50 EMA | $78.82 |
Resistance | $78.11 |
Support | $72.52 |
Support | $65.86 |
Hyperliquid Price Prediction: Bull, Base, and Bear Scenarios
Scenario | Trigger | Target | Invalidation |
Bull | Candle trading above the $78.82 EMA level | $82.68 then $88.55 | Falls back below $72.52 |
Base | Between $72.52 and $78.11 levels | Range Trade | Break of either level |
Bear | Candle trading below $72.52 | $65.86 | Reclaim of $78.11 |
Risk factors include regulatory delay, an ETF-flow reversal, and technical invalidation. A break under $72.52 would cancel the base case.
Hyperliquid Price Forecast: Expert Outlook
As CoinGabbar analysis, this Hyperliquid price prediction is range-bound with a bearish tilt. Price trades 5.5% below the $78.82 50 EMA level, and an RSI of 39.15 favours sellers. Watch live KRW volume on Upbit and Bithumb. If it fades while the price tests that EMA, sellers keep control.
Disclaimer: This article is for information only and isn't financial advice. Traders should do their own research and risk only what they can afford to lose.
0
0

 Manage all your crypto, NFT and DeFi from one place
Securely connect the portfolio you’re using to start.


