
Bitcoin Price Prediction: BTC Sits on the $75,700 Cost Basis of Recent Buyers

0
0

Bitcoin is trading at around $75,900 on Saturday morning, roughly €68,100, according to CoinGecko price data. That puts the price almost exactly on the cost basis of short-term investors, which the analytics firm Glassnode put at $75,700 in its weekly report of November 4. What the data show: most of the coins bought over the past five months are now under water, and three important levels converge below the price between $73,000 and $76,000. Our assessment follows further down. The zone is sturdier than the mood suggests, but a daily close below $73,000 would change the picture.
Where the price could head over the coming months is covered in our Bitcoin price prediction. This article sticks to the short term and to a metric the price chart alone does not show: the average price at which the most recent buyers got in.
Short-term holder cost basis: what Glassnode measures at $75,700
Glassnode splits all bitcoin into two groups by age. Short-term holders are addresses whose coins last moved less than 155 days ago. The cost basis of this group is the average price at which those coins last changed hands. On November 7, that window reaches back to early June 2026.
The metric matters because it reflects the behaviour of a specific group of investors. Someone who bought only a few weeks ago reacts more sensitively to losses than someone who has held for years. When the price trades above the cost basis, recent buyers are on average in profit and rarely sell in a hurry. When it falls below, they slip into the red. Some of them then sell as soon as the price returns to their entry level, so they can get out without a loss. That is why the line often acts as support in uptrends and as resistance in downtrends.
Alongside the short-term holder cost basis, Glassnode cites the True Market Mean at $77,700. It describes the average cost basis of all active investors, excluding coins that have not moved for a very long time. Bitcoin closed just below this line on November 3 and fell to $76,100 overnight before initially recovering. Since Thursday's slump, bitcoin has been trading about $1,800 below it.
38 percent in profit: how quickly recent buyers flipped to losses
At the start of October, according to Glassnode data, almost every coin held by short-term investors was in profit. The share reached 97.5 percent or more, a zone Glassnode flags as a sell line: nearly every recent buyer had a gain they could take. After the decline from the September high, the share has dropped to around 38 percent. Most coins from the past five months are therefore below their purchase price.
The September high, according to CoinGecko daily data, was $86,597 on September 22. Measured from today's level, bitcoin has lost a good 12 percent since then. The decline came in steps. In early November the price swung between $76,700 and $78,300; on November 5 it opened at $80,443, on November 6 at only $76,006. A one-day drop of 5.5 percent pushed a large share of recent buyers below their entry price at a stroke.
Glassnode reads the swing as a cooling of excess: the market is far less stretched than in September. If the share in profit climbs back above 50 percent while the price holds, the analysts would take that as a sign that recent buyers are regaining confidence. It would not take much, since the price would only need to rise a little above the $75,700 cost basis and stay there.
Bitcoin support between $73,000 and $76,000: three levels in one place
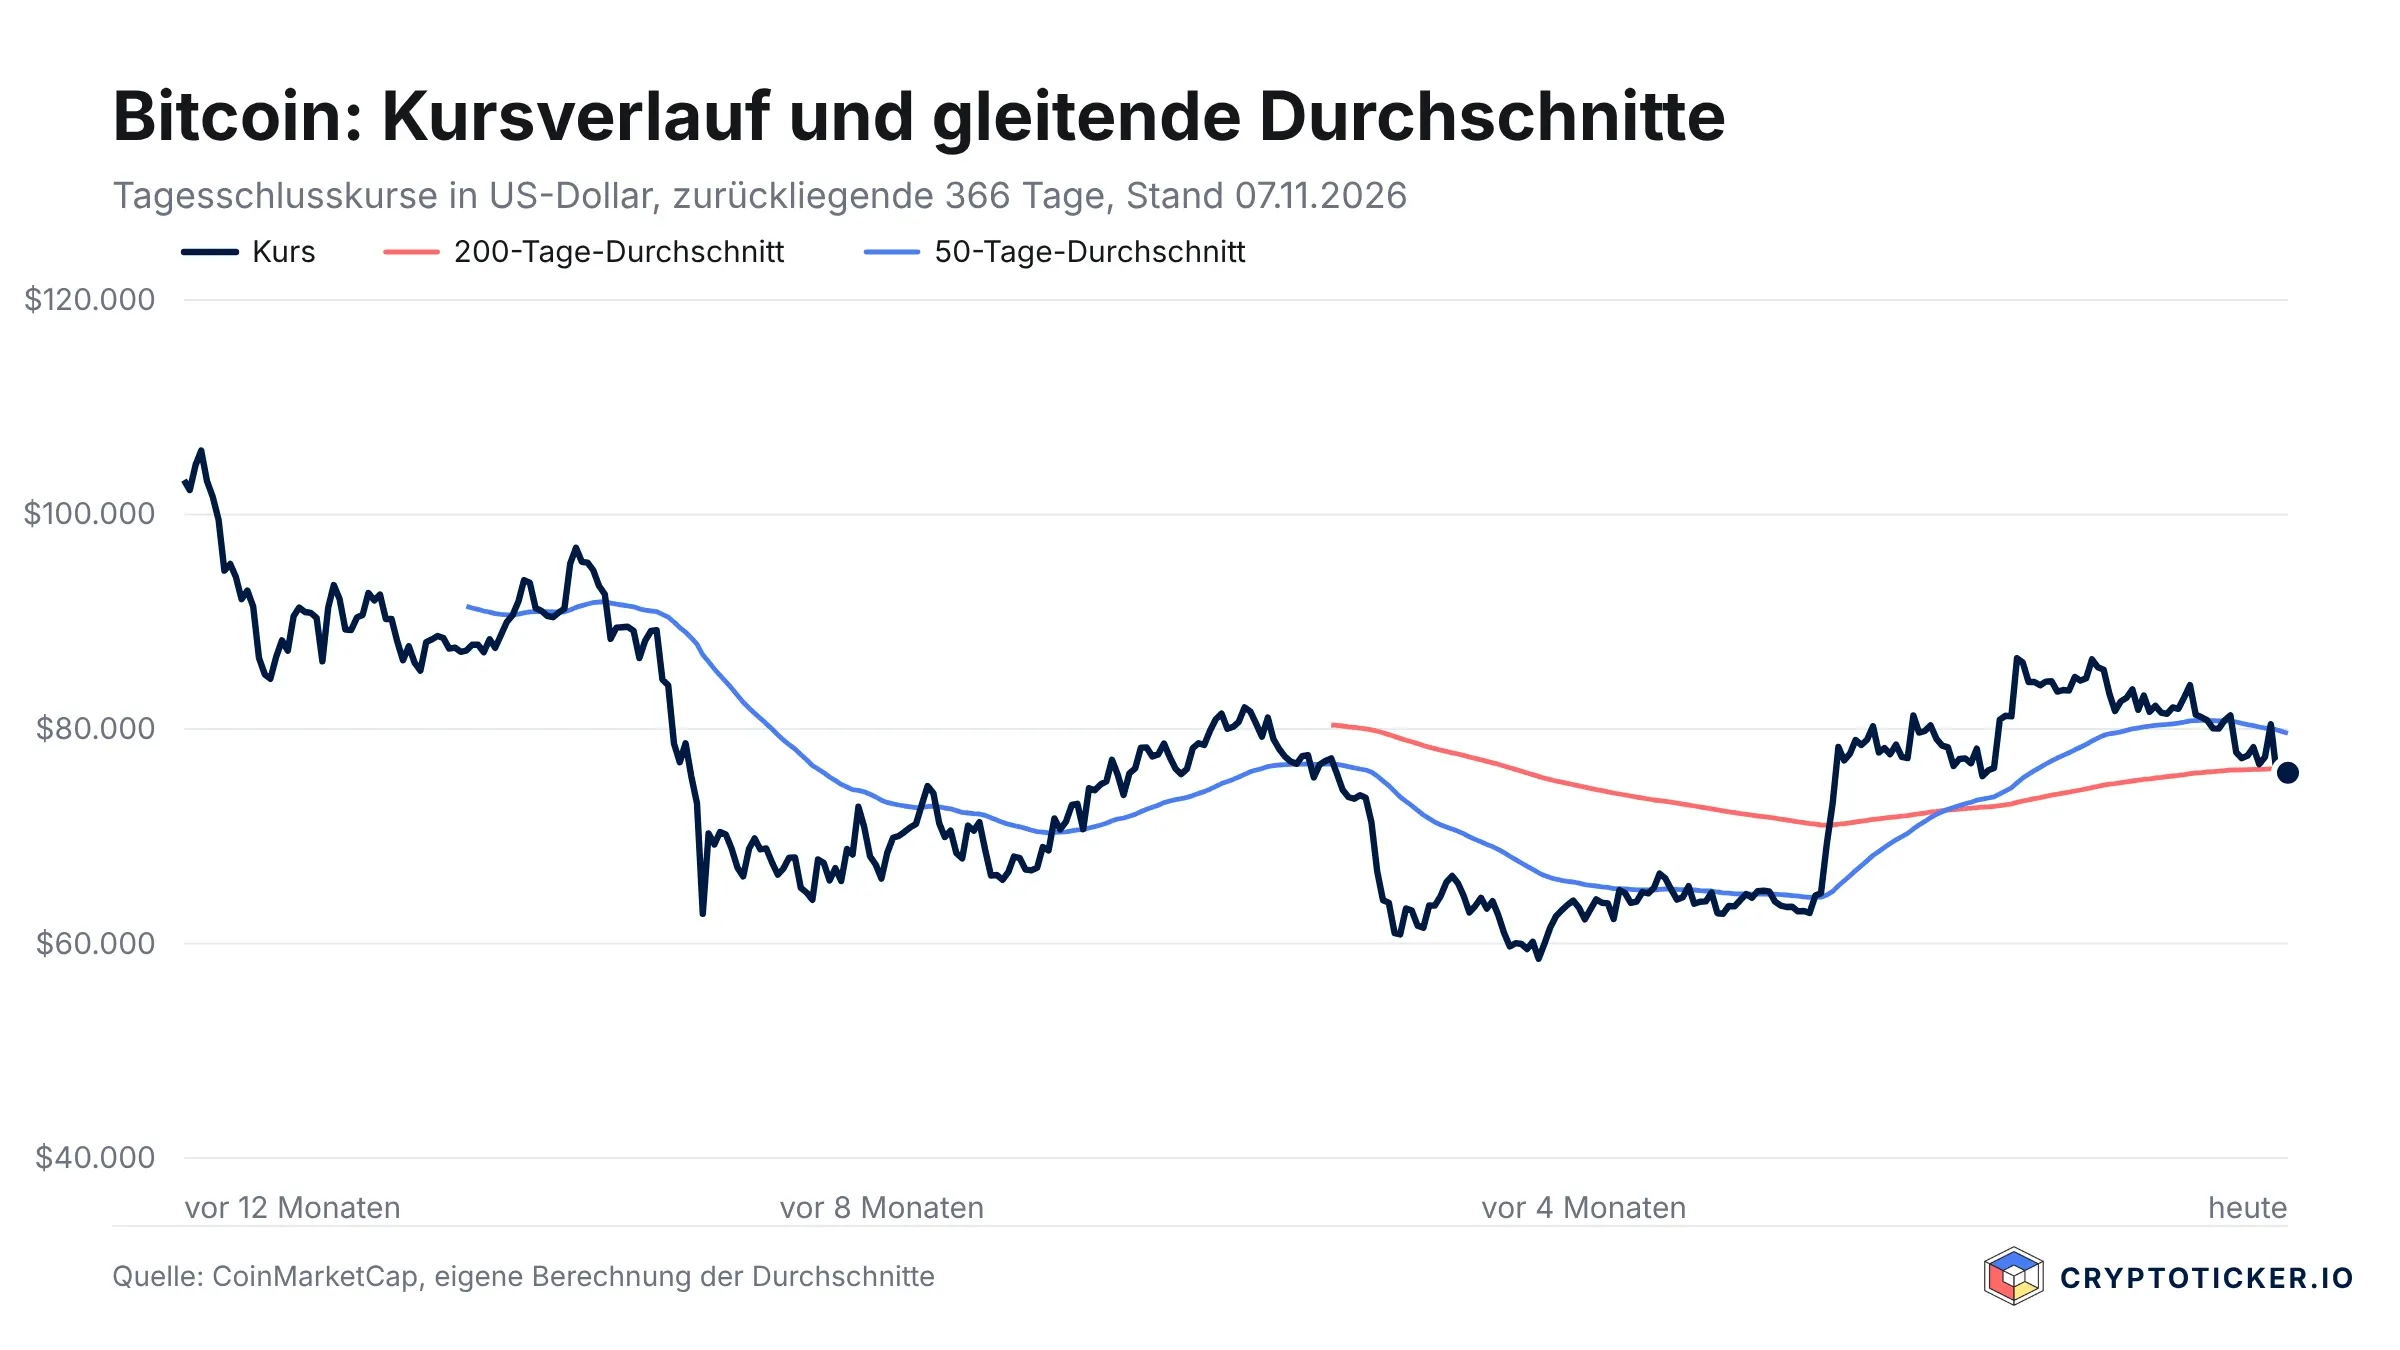
Three levels sit close together below the current price. The first is the short-term holder cost basis at $75,700. The second is the average of the past 50 weeks: by our own calculation from CoinGecko daily data, averaged over 350 days, it stands at around $75,770 on Saturday. The third is the simple 200-day moving average at around $73,200. It measures the mean price of the past 200 days, and many market participants treat it as the dividing line between an uptrend and a downtrend.
Glassnode reaches the same conclusion from data on leveraged futures. After the slide from the September high, many liquidation levels for long positions have already been cleared. A liquidation is the forced closure of a leveraged position once the posted collateral no longer covers the loss. Below the price, Glassnode says, what remains is mainly a band between $73,000 and $76,000, plus a large block between $60,000 and $63,000 left behind by the August breakout.
The zone therefore cuts both ways. On the one hand, the band attracts buyers, because many investors defend their entry price there. On the other, it can trigger a wave of forced selling if the price breaks through it and the long positions sitting there are closed. If you trade with leverage yourself, compare your position's liquidation price with this band. If it lies between $73,000 and $76,000, it sits exactly where many other positions would be wiped out too.
Bitcoin since Friday evening: the $74,790 low has held
Our prediction from Friday evening focused on outflows from US bitcoin ETFs and named two levels: Friday's low of $74,790 on the Kraken exchange and the 200-day line, then at $73,192 according to Kraken data. Bitcoin stood at around $75,800 on Friday evening. Little has moved since, and that calm is the weekend's finding. According to CoinGecko, the low of the past 24 hours is $74,921 and the high $76,266. At just under 1.8 percent the range is narrow, and both of Friday's levels are untouched.
What is new is the view of cost bases. Friday's prediction worked from price action and fund flows. The Glassnode metric asks where the coins were actually bought. Both approaches lead to the same zone, and that agreement makes it more reliable than any single line. Sentiment is new as well: the Fear and Greed Index from alternative.me fell to 25 points on Saturday, into extreme fear, after 28 points on Friday and 50 on Thursday.
Short positions above the market: the biggest block sits at $87,000
Above the price, the opposite has built up over the past week. According to Glassnode, liquidation levels above the price grew even though bitcoin lost around 3.5 percent over the period. Traders opened short positions into the decline, that is, bets on falling prices. The largest block sits at around $87,000, close to the September high.
Positions like these are fuel for a counter-move. If the price rises, short sellers have to buy back from a certain level to limit their losses, or their positions are closed by force. Those purchases push the price higher still, a process known as a short squeeze. From today's level, though, $87,000 is almost 15 percent away. Two stops lie on the way: first the True Market Mean at $77,700, then the zone around $80,000, where bitcoin turned lower on Thursday.
For retail investors, this argues against high leverage in either direction. A short squeeze hits bets on falling prices as hard as a slide through support hits leveraged buyers. Regulated crypto brokers cap leverage on crypto CFDs for retail clients in the EU at two to one, while trading venues outside the EU often offer many times that.
Options market and ETF flows: $18 billion in calls, hardly any fresh money
In the options market, according to Glassnode data, traders hold call options worth around $18 billion across all maturities, against put options of $13 billion. The largest December call positions sit at $80,000, $90,000, $100,000 and $120,000, the largest puts at $60,000 and below. Glassnode itself cautions that open positions do not show who bought and who sold. The analysts believe part of the calls come from holders earning a premium with them.
The next two big expiries are November 27, with $5.7 billion in open interest, and December 25, with $12.5 billion. The max pain price, at which the largest share of options expires worthless, is $80,000 for November and $76,000 for December. It therefore sits on both sides of the current price. Glassnode consequently sees no clear pull in either direction from the options market.
Outside support is missing. According to Glassnode, US spot ETFs lost a net amount of just under $1 billion in the two weeks to November 2. For November 2 itself, sources cite between $398.6 million (SoSoValue data via the TFTC tracker) and $640 million (Glassnode). Trading in the funds has been running at about $1.3 billion a day since May, roughly a third of the earlier pace. Glassnode describes a market in which mostly capital already in crypto is circulating, while noting that ETF flows have so far tended to follow the price rather than lead it.

Bitcoin after the midterms: earlier elections were followed by one last pullback
On November 3, the Democrats won both chambers of Congress in the US midterm elections, by a wider margin than expected. Glassnode analysed the three previous midterms. After each of those elections, bitcoin made one last pullback before reaching its cycle low: between 15 and 50 percent, two to ten weeks after election day.
This time, much of the decline came before the vote. From the September high to election day, bitcoin lost around 11 percent according to Glassnode, and by November 4 it was up about 1.5 percent since the election. Thursday's slump has wiped out that lead. Three elections are a small sample, as Glassnode itself stresses. As a pattern they are enough to take the possibility of another pullback seriously; as a roadmap they are not. Bitcoin is also far more embedded in the traditional financial system today, through ETFs, asset managers and banks, than in earlier cycles.
Bitcoin price prediction to the end of November: two scenarios with fixed levels
From the cost bases and the liquidation levels, two paths can be drawn for the coming three weeks. In each case the daily close is what counts, not a brief intraday spike.
Stabilisation: a daily close above $77,700
If bitcoin holds the zone around $75,700 and manages a daily close above the True Market Mean at $77,700, the structure of the August breakout is intact again in Glassnode's reading. The share of short-term holders in profit would then rise quickly, because the price only has to sit just above their cost basis. The next level is the zone around $80,000, where bitcoin last traded on November 5 and where the max pain price of the November expiry lies. Above that, the short positions around $87,000 are waiting.
A longer pause: a daily close below $73,000
If bitcoin falls below $73,000 on a daily closing basis, the price has left behind the lower edge of the zone, the 200-day moving average and most of the liquidation levels for long positions. For that case, Glassnode speaks of a longer consolidation, a phase in which the price moves sideways to lower. The next large cluster of liquidations would then be at $60,000 to $63,000, the starting point of the August breakout. On August 1, bitcoin traded at $62,820 according to CoinGecko data; the year's low on July 1 was $58,566.
We are not giving a price target. Both scenarios depend on daily closes, which can be checked every evening.
Bitcoin support at $75,700: our editorial assessment
Our assessment: the zone between $73,000 and $76,000 has a good chance of holding. Three documented points support this. First, the cost basis of recent buyers, the 50-week average and the 200-day average meet there. Second, according to Glassnode, a large part of the leverage on the long side has already been unwound, so the risk of a cascade of forced selling is smaller than in September. Third, over the past two months bitcoin has performed much like the S&P 500, down about 2 percent, and clearly better than gold, which lost around 9 percent according to Glassnode data.
Against this view: fresh money from outside is missing, and sentiment at 25 points sits in extreme fear. If the zone breaks, a setback in the pattern of earlier midterms would not be an outlier but the historical norm. We do not derive a buy or sell recommendation from this. Cryptocurrencies are highly volatile and can lose value up to a total loss.
Crypto holding period and loss offsetting: how to check your bitcoin bought since June
Glassnode's short-term holder group overlaps in time with a tax question that directly affects investors in Germany. Anyone who has bought bitcoin since early June 2026 is still within the one-year holding period under Section 23 of the German Income Tax Act. A sale before that period ends is a private disposal. Gains are taxable once a year's private disposal gains together reach the exemption limit of €1,000. Losses from such transactions can be offset against gains of the same kind, including in later years.
That leads to three steps. For each purchase since June, note the date, the amount and the purchase price in euros; your exchange provides an export of your transactions for this. Then compare the purchase prices with Saturday's price of around €68,100: purchases from September and October are mostly in the red, while purchases from July and early August are often in profit. Finally, check whether you have already made taxable gains from other crypto sales in 2026. A realised loss can reduce them, but a sale purely for tax reasons is no substitute for an investment decision. Crypto tax software matches purchases and sales automatically, for example using the FIFO method, under which the coins bought first are treated as sold first.
There is still no decision on the planned abolition of the holding period: the federal cabinet did not adopt the draft on October 14, 2026. What applies today and which dates follow is set out in our overview of the crypto holding period reform.
Bitcoin at $75,700: below $73,000 the longer pause begins
- Set yourself two price levels and create a price alert for each: a daily close above $77,700 as a sign of stabilisation and one below $73,000 as a warning signal. Exchanges with price alerts and savings plans are listed in our crypto exchange comparison.
- Check your purchases since June against the $75,700 cost basis and against the holding period. Which software calculates your cost basis in euros is shown in our overview of crypto tax software.
- Keep leverage low while the price sits in the middle of the $73,000 to $76,000 zone. What regulated providers allow retail clients is covered in our comparison of crypto brokers.
(As of November 7, 2026. This article is not investment advice. Prices and fee structures change; check the terms with the provider before you buy.)
0
0

 Manage all your crypto, NFT and DeFi from one place
Securely connect the portfolio you’re using to start.
 Where will Bitcoin trade next?
Live Polymarket and Kalshi odds on Bitcoin price targets, compared side by side.
See Bitcoin price odds


