
XRP Could Drop 12% Below $1.26 as Fed Decision Nears and Whales Buy

0
0
The token has been unable to clear the $1.31 ceiling as traders wait for the Fed decision on October 28.
Whales hold about 68.5% of the supply, yet the daily chart still favors sellers.
A break below $1.26 could send the token toward $1.11, a drop of about 12%.
XRP is trading at $1.3005, up 1.25% in 24 hours, as investors wait for the Federal Reserve. Bulls keep defending the $1.30 area, but sellers have not gone away.
Bitcoin slipped under $80,000. Worries about AI spending, high oil prices, and the fourth quarter of a midterm election year added more pressure.
Traders Don't Expect a Fed Rate Hike on Wednesday
The consensus is that the Fed will hold. CME FedWatch shows an 89.5% chance of no change and a 10.5% chance of a hike. The current target range is 375 to 400 basis points.
| Timeframe | No change | Hike |
| Now | 89.5% | 10.5% |
| 1 day ago | 90.0% | 10.0% |
| 1 week ago | 81.2% | 18.8% |
| 1 month ago | 35.8% | 64.2% |
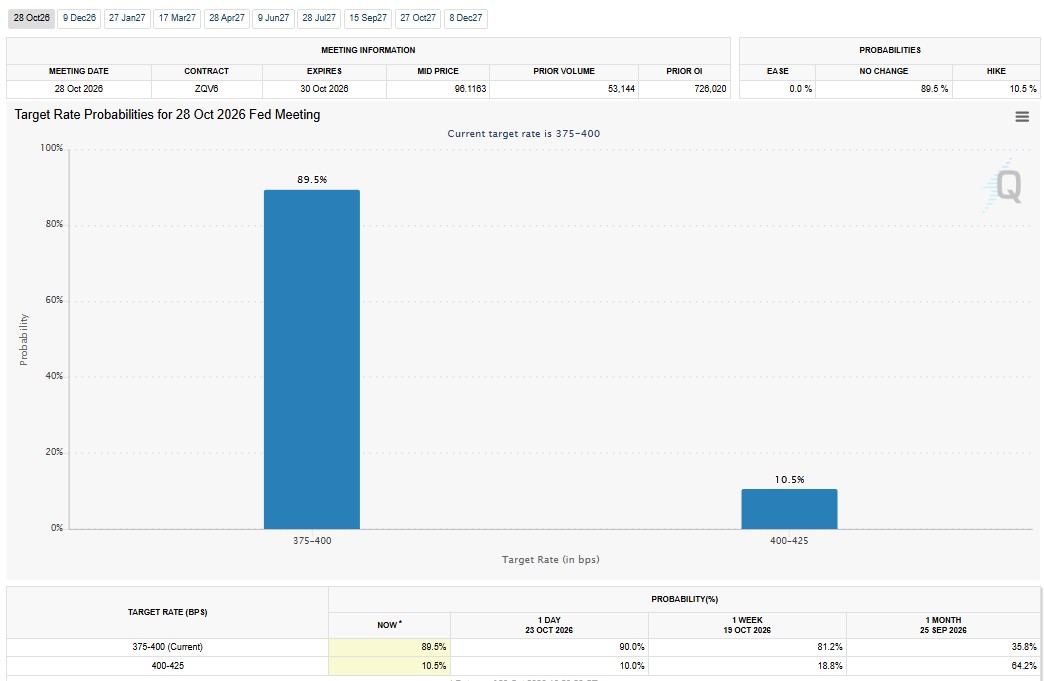
Fed Rate Odds for October 28, 2026 - Source: CME Group
A month ago, hike odds sat at 64.2%. Expectations have shifted a lot.
Any surprise, meaning a premature hike, could hurt risk assets and push crypto below nearby support.
Fear and Greed Index Falls to 48 as Crypto Sentiment Cools
The index dropped to 48, which is Neutral. A month ago, it stood at 70.
| Period | Index | Mood |
| Now | 48 | Neutral |
| Yesterday | 50 | Neutral |
| Last week | 55 | Greed |
| Last month | 70 | Greed |
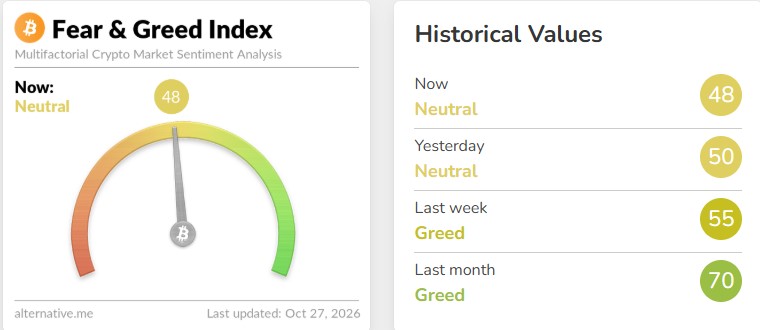
Crypto Fear and Greed Index - Source: Alternative.me
Ripple National Trust Bank Gets Final OCC Approval
Ripple's Brad Garlinghouse said the OCC has granted final approval for Ripple National Trust Bank. He shared the news ahead of RippleSwell.
The bank gives Ripple a federally supervised platform to support RLUSD. It can also offer digital asset custody to enterprises.
The token still trades below its key moving averages, so the market has not rewarded the news yet.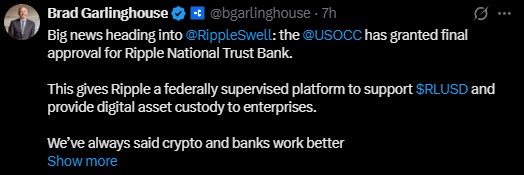
XRP Whales Now Control the Most Supply Since 2022
Wallets holding at least 10M XRP now control 46.87B tokens. That is roughly 68.5% of supply, the highest share since November 2022.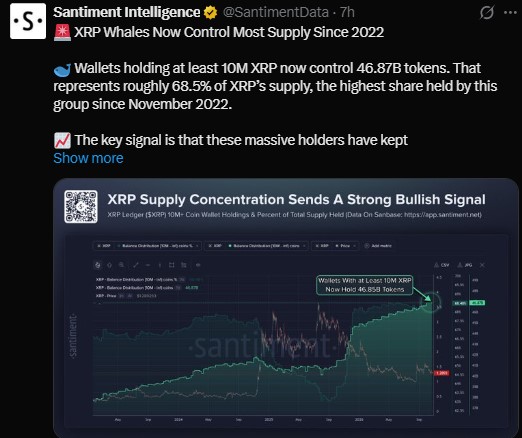
Whale Concentration - Source: Santiment
These big holders kept adding while the price struggled near $1.29. That hints at strong conviction. Still, whales can be wrong too.
Analysts call $1.30 the immediate pivot and $1.50 the stronger confirmation. Holding above $1.20 keeps the accumulation story alive.
ETFs Post Small Outflows, but Total Inflows Stay at $1.80B
As of October 26, daily net outflow was $3.61M. Total net assets are $1.47B, or 1.80% of market cap. Total value traded was $22.76M.
Only Bitwise saw flows on the day. The other four funds saw none.
| Fund | Cumulative net inflow | Net assets |
| Bitwise | $679.58M | $535.17M |
| Franklin Templeton | $518.60M | $395.89M |
| Canary | $484.34M | $314.87M |
| Grayscale | $145.38M | $84.50M |
| 21Shares | -$21.15M | $138.76M |
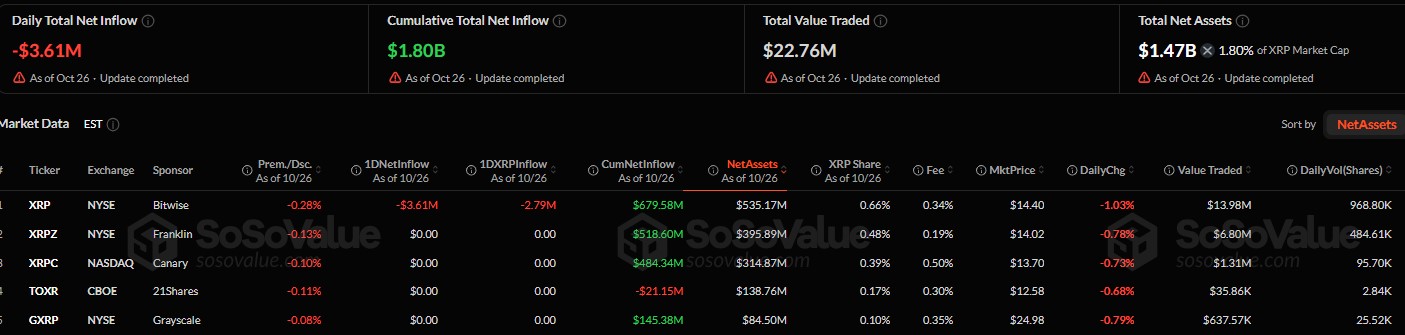
Spot ETF Flows - Source: SoSoValue
All five funds closed lower on the day, between 0.68% and 1.03%.
Futures and Options Data Show Rising Activity
Market cap is $82.10B. Volume and open interest are both up.
| Metric | Value | Change |
| Futures volume (24h) | $2.22B | +6.14% |
| Spot volume (24h) | $385.61M | n/a |
| Open interest | $2.97B | +4.06% |
| Options volume | $8.88M | +162.26% |
| Options open interest | $76.61M | +8.92% |
| Long/short ratio | 1.0942 | n/a |
Account ratios lean long on Binance (3.1254) and OKX (3.32). Binance top traders show 3.8008 by accounts and 2.0608 by positions.
Liquidations hit $1.25M in 24 hours. Longs lost $657.41K, and shorts lost $589.04K. Both sides remain active.
Daily Chart Stays Bearish Below All Four Moving Averages
The token trades near $1.3012 inside a descending channel, with lower highs and lower lows. The RSI at 40.63 sits under the neutral 50 line.
| Indicator | Level |
| EMA 20 | $1.3406 |
| EMA 50 | $1.3602 |
| EMA 100 | $1.3333 |
| EMA 200 | $1.3709 |
| RSI (14) | 40.63 |
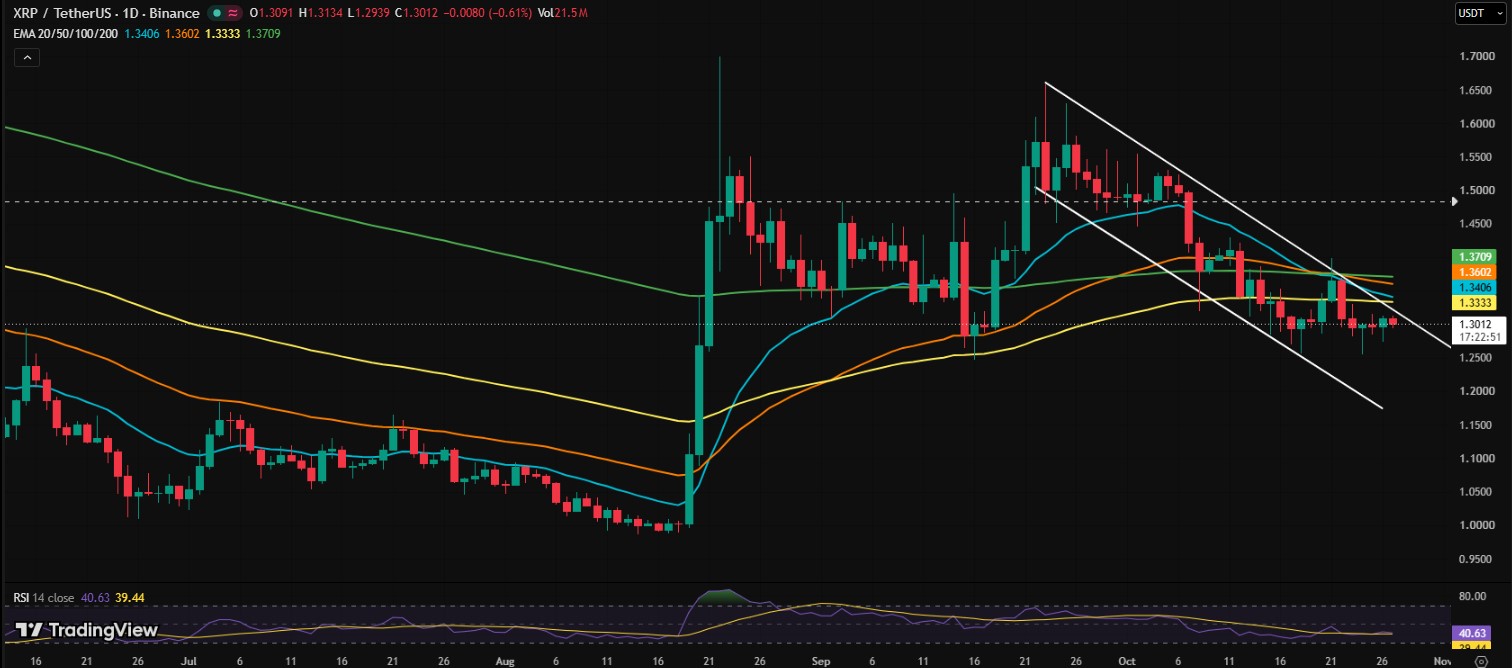
Daily Chart with EMAs and RSI - Source: TradingView
Hence, the chart leans bearish to sideways. Buyers need to reclaim the moving averages and break the channel to change that.
XRP Could Drop by 12% If It Breaks Below $1.26
On the 4-hour chart, a move above $1.31 has been rejected twice since Friday's bearish breakout.
Analyst Ali points to $1.26, the lower edge of a channel forming since August. A break could first lead to $1.11. The channel ultimately points to $0.98, about 22% below $1.26.
| Level | What it means |
| $1.50 | Stronger confirmation level |
| $1.37 to $1.40 | Recovery zone if buyers clear $1.34 to $1.36 |
| $1.30 | Immediate pivot |
| $1.28 to $1.25 | Support zone |
| $1.20 | Next level if $1.25 breaks |
| $1.11 | First target below $1.26 |
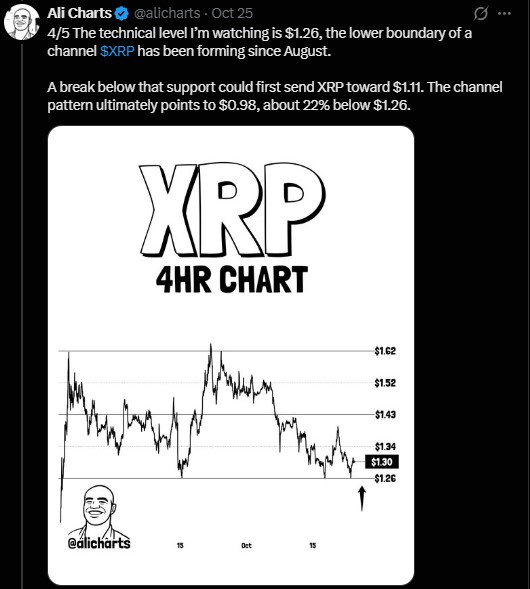
These are scenarios, not guaranteed targets. Whale buying and a calm Fed could help. A rate surprise could do the opposite.
Disclaimer
This article is for information only and is not financial advice. Crypto is volatile, and you can lose money. Price levels are technical scenarios, not guaranteed outcomes. Do your own research and speak with a licensed advisor before investing.
0
0

 Manage all your crypto, NFT and DeFi from one place
Securely connect the portfolio you’re using to start.


