
Quant Price Prediction November 2026: QNT Key Levels to Watch

0
0

Can a decade-old crypto firm still move its own token? Quant unveiled a headline upgrade, yet $QNT slipped 3.3% in a week, and the chart barely blinked.
This Quant price prediction November 2026 tests that gap against holder data, liquidations, and futures volume, building on the Quant support and risk map published earlier.
QNT Price Market Snapshot
Every Quant price prediction needs numbers first, taken from CoinGecko data on Oct 26, 2026, 06:15 UTC. $QNT price sits at $193.74, with a market cap, the value of circulating coins, of $2.758B.
Metric | Value |
Price | $193.74 |
7-day change | -3.3% |
Market cap | $2.758B |
Fully diluted valuation | $2.769B |
24-hour volume | $78.707M |
Circulating supply | 14.556M QNT |
Fully diluted valuation, the value if every coin existed, reads barely above market cap. That's because 14.556M of 14.612M QNT has already circulated.
QNT Holders Show Heavy Supply Concentration
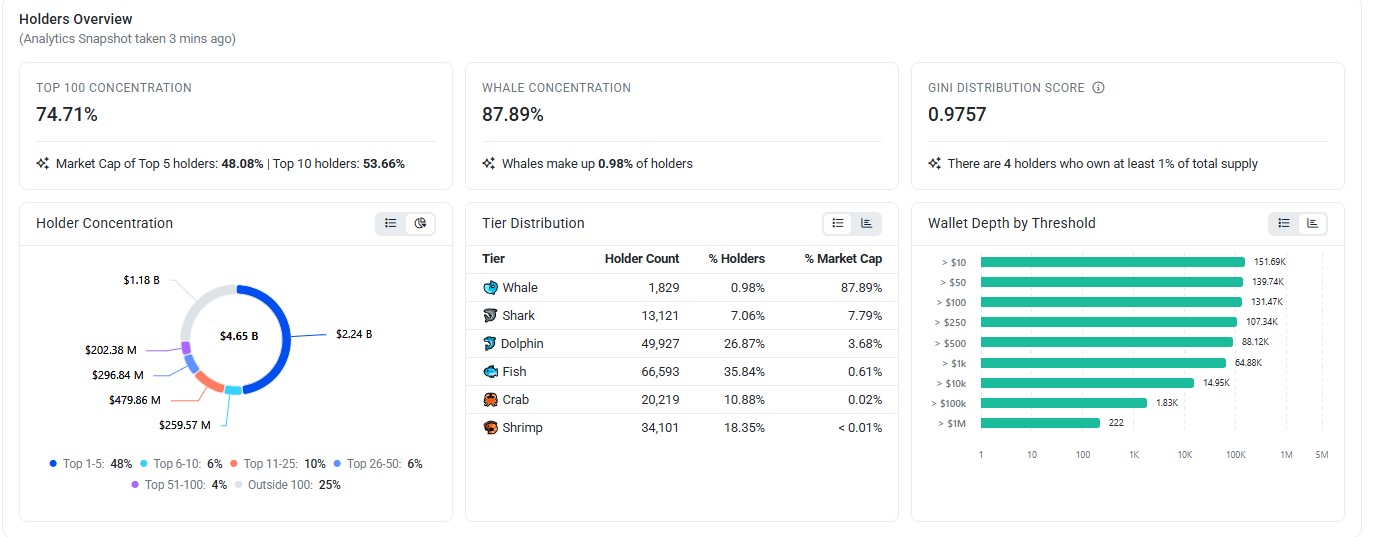
Etherscan holder data counts 185,764 $QNT holders, yet the top 100 wallets control 74.71% of supply. The Gini score sits at 0.9757. That's extreme.
Supply tells part of the story. The rest comes from who holds it, starting with the QNT token contract at 21.0062%, likely a parked supply rather than a seller. And four wallets hold at least 1% each.
Quant Whale Wallets Own Most of the Market Cap
Whales, meaning wallets with large bags, number 1,829, just 0.98% of holders, yet Quant whale wallets own 87.89% of market cap. Everyone else splits the crumbs.
Two wallets hold about 600,000 QNT each, worth $113.46M apiece, while a Binance hot wallet, an exchange wallet handling withdrawals, holds 553,381.876 QNT worth $104.64M. Similar concentration appears across other altcoin price setups. So who actually steers QNT?
QNT Liquidations Hit Shorts First, Then Longs
$QNT liquidations rattled the market. A liquidation is a forced exit from a borrowed-money trade when margin runs out. CoinGlass liquidation data shows $376.27K wiped in 24 hours. Shorts took $244.62K. Longs lost $131.64K.
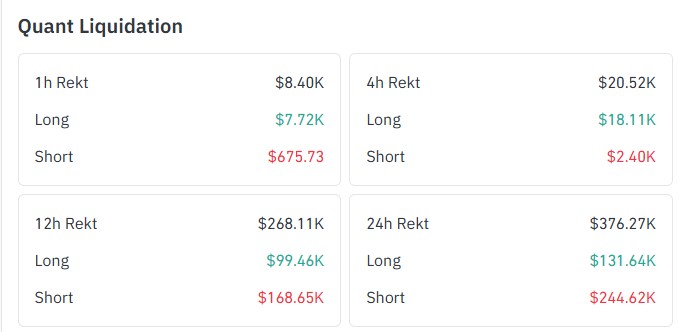
But the tide turned. Over 12 hours, shorts led with $168.65K against $99.46K for longs. In the last 4 hours, longs lost $18.11K to $2.40K for shorts.
QNT Open Interest and Futures Volume
$QNT open interest, the value of futures contracts still active, stands at $201.684M, about 7.3% of the $2.758B market cap, while LBank leads futures volume at $169.66M, ahead of Binance at $97.11M and MEXC at $57.86M.
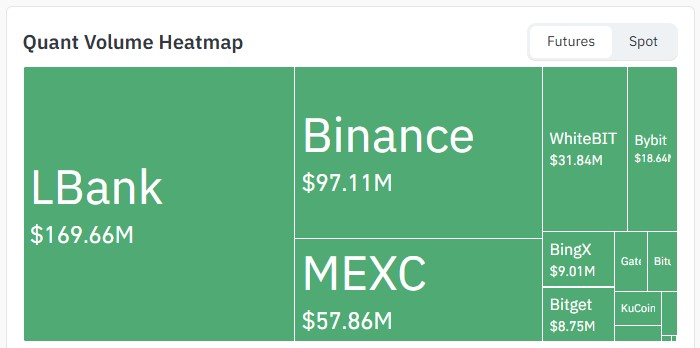
Source: Data taken from CoinGlass
Those three alone add up to $324.63M, over four times spot volume of $78.707M, which is plain buying and selling with no borrowing. But borrowed money cuts both ways.
QNT Price Forecast: 1-Day Chart Analysis
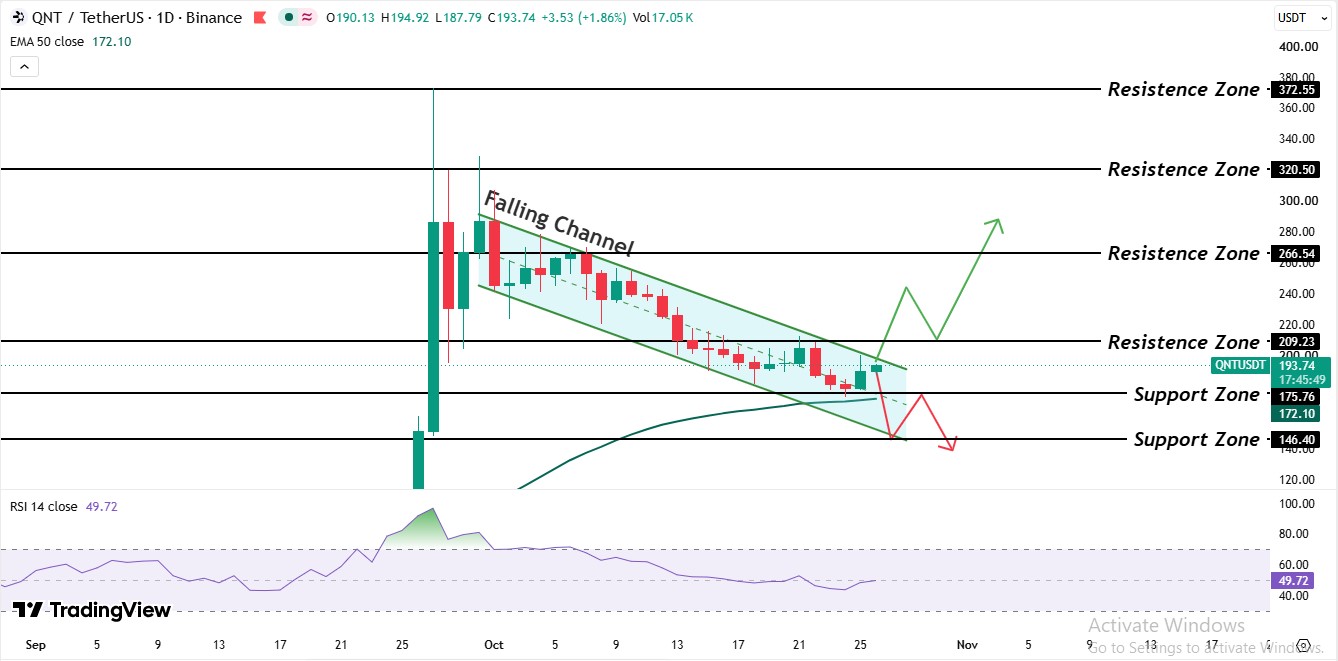
The daily chart tells it in order. A vertical spike toward $372.55 came first, then trading settled into a falling channel, with two sloping lines boxing price in as highs and lows drift lower. Call it consolidation after a breakout.
Price has bounced to $193.74 and keeps pressing the channel roof. Shorts got liquidated on the way up, and longs took the hit later. That reads as a breakout. Actually the channel still holds the price.
Price trades above the EMA 50 at $172.10. The EMA is a trend line weighting recent prices more heavily. That gap of $21.64 gives buyers a cushion.
And RSI has cooled from a spike above 90 to 49.72. The spike showed overheated buying, and the slide shows the heat is gone, so momentum sits neutral.
Quant price prediction November 2026: Support and Resistance Levels
Support is a floor where buyers step in, and resistance is a ceiling where sellers do short selling.
Level | Type | Note |
$372.55 | Resistance | Spike high |
$320.50 | Resistance | Major ceiling |
$266.54 | Resistance | Extended target |
$209.23 | Resistance | First hurdle |
$175.76 | Support | First floor |
$172.10 | EMA 50 | Trend cushion |
$146.40 | Support | Channel base |
QNT Price Prediction: Bull, Base, and Bear Scenarios
Scenario | Trigger | Invalidation |
Bull | Trades above $209.23 and the channel roof | Falls back under $175.76 |
Base | Chops between $175.76 and $209.23 | Breaks either level |
Bear | Loses $175.76 | Trades above $209.23 |
Quant Price Prediction November 2026: Expert Outlook
As per CoinGabbar analysis, this Quant price prediction November 2026 is bearish for now. Price sits above the EMA 50 at $172.10, which gives buyers a base, but lower highs keep the falling channel intact, and $209.23 still caps the upside.
But a daily push above $209.23 would flip the view, while a loss of $175.76 opens $146.40. Until then, this Quant price prediction November 2026 favors bears, and the latest crypto news can shift that fast.
Disclaimer: This article is for information only and isn't financial advice. Crypto assets are highly volatile, and prices can move sharply in either direction. Readers should do independent research and consider their own risk tolerance before making any decision
0
0

 Manage all your crypto, NFT and DeFi from one place
Securely connect the portfolio you’re using to start.


