
Bitcoin price analysis: BTC breaks the July low, is $50,000 next?

0
0
Bitcoin has broken through the floor that held all year. $Bitcoin dropped to $55,150 early on Saturday, 21 November 2026. That is below the July low of $57,700 and the lowest level since September 2024. At 11:00 UTC, BTC traded at $57,822, down 6.6% in 24 hours and 14% over the week. From its record close of $124,753 in October 2025, bitcoin has now lost 54%, and 40% from this year's high of $96,929 in January.
Live prices are on our crypto prices page. These are the levels that matter now:
| Level | Price | Why it matters |
|---|---|---|
| Resistance 3 | $72,532 | 200-day moving average |
| Resistance 2 | $67,974 | 200-week moving average |
| Resistance 1 | $60,000 | Old range floor, now resistance |
| Price now | $57,822 | 21 November 2026, 11:00 UTC |
| Support 1 | $55,150 | Saturday's low |
| Support 2 | $53,949 | September 2024 low (daily close) |
| Support 3 | $50,000 | Psychological level |
Why did bitcoin break the July low?
Several drivers hit at once: markets expect the Fed to raise rates in December, AI and chip stocks keep sliding, spot ETFs are losing money, and leveraged longs are being flushed out. When BTC lost $60,000 on Friday evening, $553 million was liquidated in one hour. Over 24 hours, liquidations reached $2.64 billion, and 90% of them hit traders betting on higher prices.
Is bitcoin below the 200-week moving average?
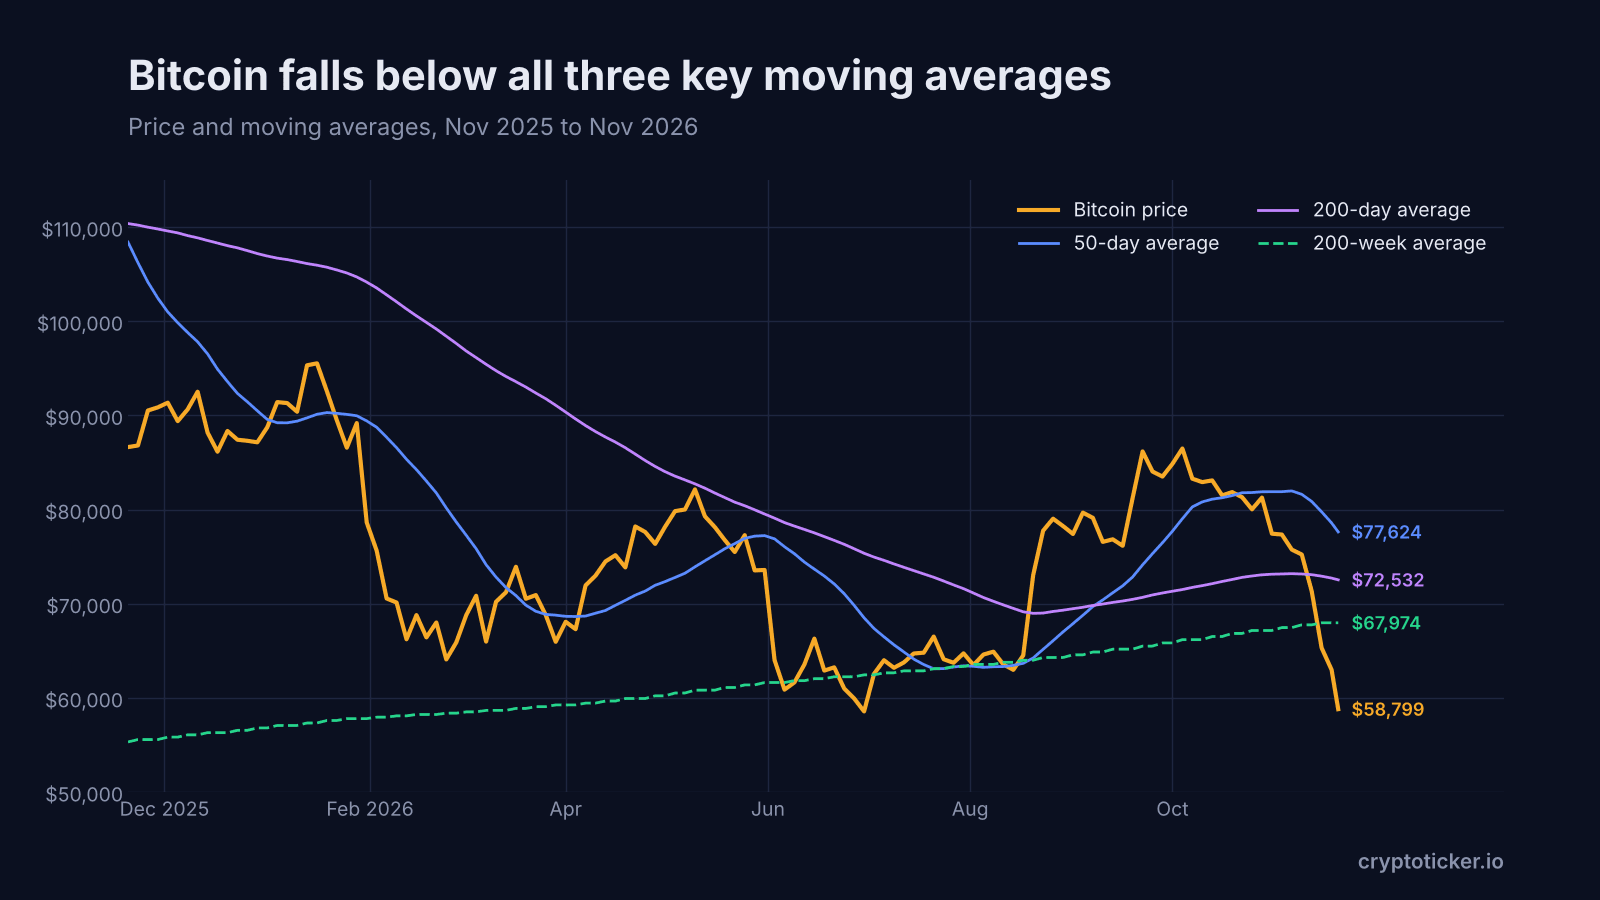
Yes, and that is the most important signal on the chart. The 200-week moving average, often seen as the long-term floor of a bull cycle, sits at $67,974. Bitcoin trades about 15% below it. It is the second break this year: in late June, BTC also slipped under the line before reclaiming it in August. In the 2022 bear market, bitcoin stayed below its 200-week average for months before the cycle bottomed.
The shorter averages point the same way. The 50-day moving average stands at $77,624 and the 200-day at $72,532, both well above the price. The 50-day line has dropped by more than $3,700 in ten days, so a death cross, when the 50-day falls below the 200-day, could follow within weeks if the slide continues.
Is bitcoin oversold?
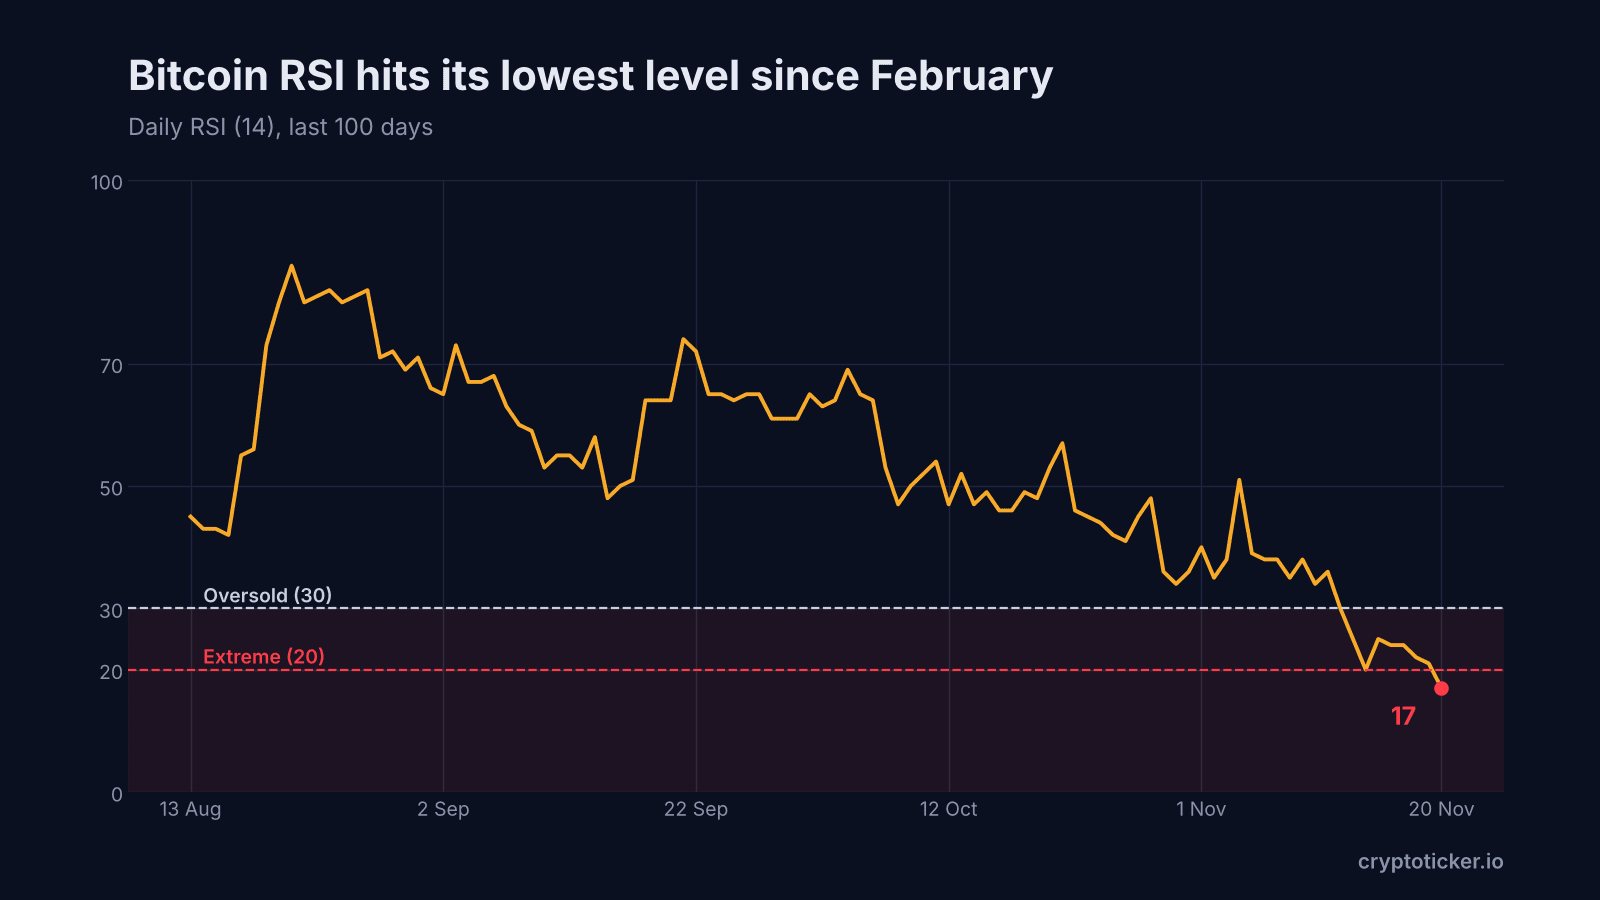
Very. The daily RSI (14) closed Friday at 17, its lowest reading since February 2026, when it hit 16 with bitcoin at $62,702. Readings below 20 are rare and usually come near short-term lows.
History gives no guarantee, though. Since 2022, the daily RSI fell below 22 five times before this week. Thirty days later, bitcoin was higher three times, by 4% to 7%, flat once and 8% lower once, in June 2026. Oversold markets tend to bounce, but a bounce is not a bottom.
Bitcoin support levels: how low can BTC go?
The first support is Saturday's low at $55,150. Below that, the September 2024 low at $53,949 (daily close) is the last major floor before round numbers take over. Wintermute has flagged the $50,000s as the zone that decides the bigger trend, and $50,000 is also the psychological level most traders watch.
Bitcoin resistance levels: what does BTC need to recover?
The broken lows now act as resistance. The first hurdle is the band between $57,700 and $58,559, the July low and the June closing low. Above that comes $60,000, the old floor of the range. A real trend change would need a weekly close back above the 200-week average at $67,974.
Bitcoin price prediction: three scenarios for the coming weeks
Bullish scenario: relief rally toward $64,000
With the RSI this stretched, a short squeeze is possible. If bitcoin reclaims $60,000, the mid-November range between $62,000 and $65,000 is the next target. A softer tone from the Fed or a return of ETF inflows could trigger it.
Base scenario: sideways between $54,000 and $60,000
Crashes are often followed by weeks of choppy trading. Until the Fed decision on 9 December, bitcoin could swing inside the range between the September 2024 low and $60,000.
Bearish scenario: a slide to $50,000
A daily close below $53,949 would open the way to $50,000. More forced selling, further ETF outflows or a half-point Fed hike would make this scenario more likely.
What does the bitcoin chart mean for investors?
The trend points down on every timeframe, and the indicators are stretched. That mix often produces sharp swings in both directions. Avoid leverage, decide in advance at which levels you would buy or reduce, and keep coins you do not trade in your own wallet. For live updates during the crash, follow our bitcoin crash live ticker.
0
0

 Manage all your crypto, NFT and DeFi from one place
Securely connect the portfolio you’re using to start.
 Where will Bitcoin trade next?
Live Polymarket and Kalshi odds on Bitcoin price targets, compared side by side.
See Bitcoin price odds


