
JPMorgan Ranks Bitcoin Above Stocks and Gold — But Warns of 55% Volatility

0
0

JPMorgan ranks Bitcoin above stocks and gold in its newest forecast. The bank put Bitcoin into its Long-Term Capital Market Assumptions for the first time.
The 2027 edition is the 31st, J.P. Morgan Asset Management published it on 19 October. The catch sits in the same table.
What Did JPMorgan Forecast?
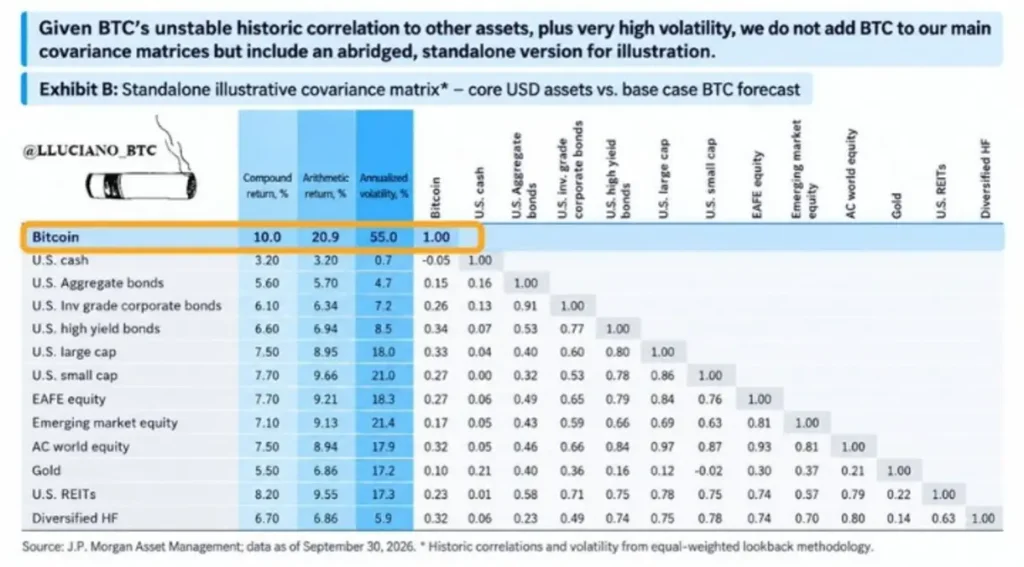
The bank projects a 10.0% compound annual return for Bitcoin over 10 to 15 years.
U.S. large-cap stocks get 7.5%, gold gets 5.5%, REITs get 8.2%, and cash gets 3.2%. Bitcoin’s arithmetic average return is 20.9%.
Forecasts carry their own risk, which is why TechGaged ranks financial experts by forecast accuracy.
Why Does 55% Volatility Matter?
JPMorgan assumes Bitcoin swings 55% a year. Gold swings 17.2%, and U.S. large caps swing 18.0%. That gap explains why the 20.9% average shrinks to a 10.0% compound return.
JPMorgan did not add Bitcoin to its main covariance matrices. It cites unstable correlations.
Its illustrative table shows a 0.33 correlation with U.S. large caps and 0.10 with gold. The bank says it introduces a range, not an allocation.
It also calls the currency debasement case “wide of the mark,” even as Kiyosaki’s “everything bubble” warning renews the Bitcoin hedge narrative. Bitwise’s Matt Hougan argues the 55% figure is too high.
What Does the Weekly Chart Say?
At 09:51 UTC on 21 October 2026, Bitcoin traded at $83,362.72. That is up 0.51%, or $424.46, on the weekly BTCUSD chart.
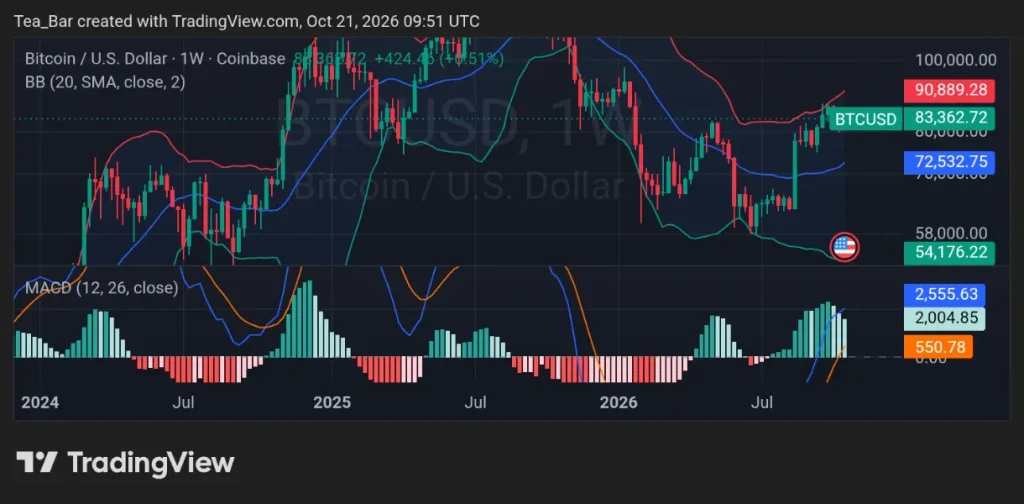
The Bollinger Bands span from $54,176 at the bottom to $90,889 at the top. The middle band sits at $72,533. Price trades in the upper half of that channel, about 9% below the top band.
The wide channel mirrors the volatility JPMorgan flags. The MACD line reads 2,555.63, above its signal at 550.78. The histogram reads 2,004.85, so momentum is positive.
A Forecast With Fine Print
Bonds are a rival for the same money. JPMorgan’s bond forecasts are its highest in two decades, and the 10-year Treasury yield sits above 5%. Stablecoins already hold a large share of Treasuries, which shows how closely crypto and rates are linked.
A Fed survey exposed a problem behind crypto’s growth as well. A bank can print a 10% estimate in one table and a 55% warning in the next. Investors will decide which number they trust more.
Disclaimer:
This article is for informational purposes only and does not constitute financial, investment, or trading advice. The views expressed are based on publicly available data, market observations, and the author’s interpretation at the time of writing. Cryptocurrency markets are highly volatile and unpredictable, and past performance or current technical setups do not guarantee future results. Readers should conduct their own research and consult with a qualified financial advisor before making any investment decisions. TechGaged does not accept liability for any losses incurred based on the information presented.
The post JPMorgan Ranks Bitcoin Above Stocks and Gold — But Warns of 55% Volatility appeared first on TechGaged.
0
0

 Manage all your crypto, NFT and DeFi from one place
Securely connect the portfolio you’re using to start.
 Where will Bitcoin trade next?
Live Polymarket and Kalshi odds on Bitcoin price targets, compared side by side.
See Bitcoin price odds


