
Bitcoin Price Prediction: Can BTC Break $83,658 or Slip to $80K?

0
0

Is Bitcoin about to escape a tight box, or is this the quiet before another slide? Bitcoin price prediction searches are rising for a reason. BTC trades near $82,940 after a week that dipped to $80,393.
Earlier, a $78K downside call had traders nervous. But buyers stepped in, and now the chart's coiled. October 11, 2026, 10:45 AM IST (05:15 UTC).
BTC Price Today: Market Snapshot
Price and 24H Range
BTC price today sits at $82,940.60, up 0.37% in 24 hours. The 24H range runs from $82,559.38 to $83,092.03. That's roughly a $533 swing, per CoinMarketCap price data.
Weekly and Monthly Performance
CoinGlass data shows a 2.11% drop over seven days. But the 30-day gain is 8.39%, and the 90-day gain is 30.15%.
Trading Volume and Market Cap
Volume hit $11.98B, down 45.38% from the day before, while market cap holds near $1.66T. Weak volume on a slow creep often fades.
Circulating Supply
Circulating supply is 20.09M BTC out of a 21M cap, leaving about 0.91M coins to mine. Treasury holdings total 1.34M BTC.
Futures Data and Open Interest
Futures volume reached $18.31B. Against just $1.57B in spot, according to CoinGlass derivatives data. Open interest, the total value of live futures contracts, sits at $51.47B.
Long/Short Ratio
A ratio above 1 means more longs than shorts. Binance accounts show 1.4552, OKX reads 1.45, and top Binance traders sit near 1.54 by positions.
Liquidations
Only $4.23M got liquidated in 24 hours, and shorts took $3.10M of it. Longs lost $1.13M. Liquidation means an exchange force-sells an underfunded position. That's calm next to the selling earlier this week.
Why Is $BTC Moving Today?
Bitcoin news today is calm. BTC is up 0.37%. Volume is down 45.38%. Whales bought. Miners paused. ETFs flipped green on October 9. Nothing violent. Just a squeeze.
Bitcoin ETF Flows
$BTC ETF flows turned positive on October 9 (US Eastern Time), with $21.13M entering US spot funds, per SoSoValue ETF data.
That follows two straight outflow days: $487.07M on October 7 and $244.13M on October 8. A fresh inflow sounds bullish. Actually, scratch that, one small day proves nothing.
Whales and Miners
Whale Buying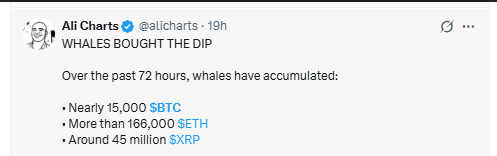
Whales bought the dip. Nearly 15,000 BTC of it, in 72 hours, per Ali Charts on X. Buying into weakness is a bullish tell, though not a guarantee.
Miner Selling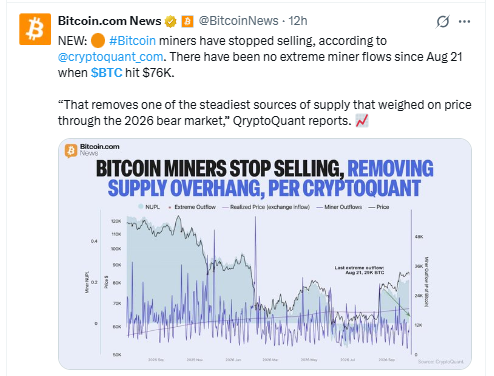
Miners have gone quiet. A Bitcoin.com News post citing CryptoQuant says no extreme miner outflows have appeared since August 21, when BTC hit $76K.
MARA Transfer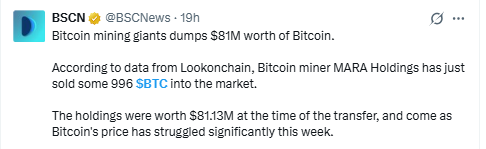
But not every miner got the memo. MARA Holdings sold 996 BTC, worth $81.13M, per on-chain data in BSCN's report. One seller doesn't flip a trend.
Bitcoin Technical Analysis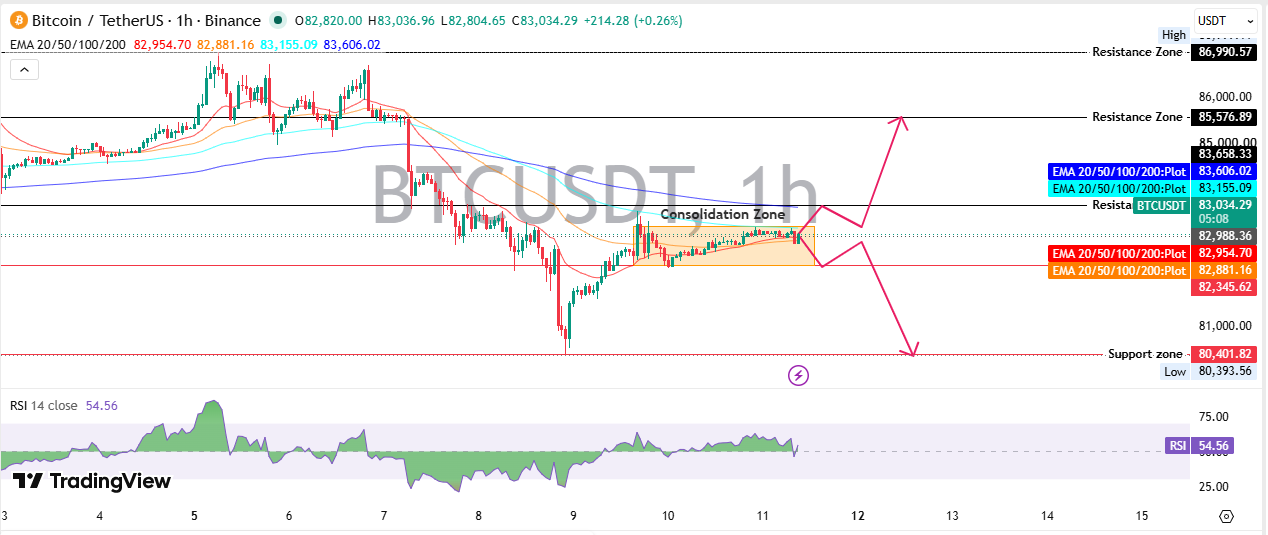
Bitcoin technical analysis starts with a tight sideways box on the 1-hour BTC/USDT chart. It runs from $82,345 up to $83,036.96, the recent high on Binance.
An EMA, or exponential moving average, weights recent trades more heavily. The 20, 50, 100, and 200 EMAs sit at $82,954.70, $82,881.16, $83,155.09, and $83,606.02 on TradingView charts.
Price trades above the first two and below the last two. RSI, a 0 to 100 momentum gauge, reads 54.56. Neutral.
ADX and Trend Strength
ADX measures trend strength, not direction. At 14.55, anything under 20 means a weak trend. So the market's ranging. But the direction isn't clear yet.
Support Levels
Among key $BTC support and resistance levels, the first floor is $82,345.62. The sideways box floor. Below that, $80,401.82 lines up with the recent low near $80,393.56. Lose $82,345 and sellers gain control.
Resistance Levels
Resistance is where sellers usually step in. First comes $83,658.33, just above the 200 EMA. Then $85,576.89 and $86,990.57. More levels for other majors sit in these crypto price predictions.
Can Bitcoin Break the Range?
Bullish Scenario
If $BTC trades above $83,658.33 and holds there, the next $BTC price target is $85,576.89. Then $86,990.57 may follow. Volume must rise first. A slide below $82,345.62 cancels this case. Yearly targets sit in 2026 BTC projections.
Base Scenario
The $BTC price forecast for the next few sessions says chop between $82,345.62 and $83,658.33. Boring. But boring often precedes big moves. Altcoins tend to follow $BTC, so this box matters for Ethereum price prediction too.
The tilt stays mildly bullish while $82,345.62 holds. Buyers want $83,658. Sellers want $82,345. So who blinks first? Volume decides.
Bearish Scenario
If BTC trades below $82,345.62, a test of $80,401.82 becomes realistic. And if whales that sold 30,000 BTC in late September return to selling, that floor could crack. Reclaiming $83,658 weakens this case.
Bitcoin Price Prediction for October 2026
Under the bull case, the $BTC price prediction for the October 2026 range is $85,577 to $86,991, if buyers clear $83,658 with volume. The base case holds $82,346 to $83,658.
The bear case points to $80,402 if sellers break $82,346. More timeframes sit on the Bitcoin forecast page.
Long-Term Bitcoin Price Forecast
Year-End $100,000 Target
Tom Lee expects $BTC above $100,000 by year-end, per Altcoin Daily's post. Can Bitcoin reach $100,000 from here? It needs a 20.6% gain in under three months.
The 90-day gain of 30.15% shows such runs happen. Still, price sits 34.3% below the $126,198.07 all-time high from October 7, 2025.
2027 and Beyond
Longer-range views sit in 2027 Bitcoin projections.
Risks That Could Change the Forecast
Exchange Headline Risk
The WSJ reports Binance processed nearly $850M in transactions tied to an Iranian sanctions-dodging network, per Whale Insider.
US Midterm Elections
US midterms arrive on November 3, 2026. The midterm election risk is real, but four past data points prove little.
Final Takeaway
The Bitcoin price prediction for now leans mildly bullish while $82,345.62 holds, with $83,658.33 as the gate. Whales and miners help. Volume doesn't. A clean break either way sets the next move. Follow crypto news updates for shifts.
Disclaimer: This article is for information only and isn't financial, investment, or trading advice. Crypto prices are highly volatile, and losses can be total. Price targets and scenarios are possibilities, not guarantees. Always do independent research and consult a licensed financial advisor before making any decision.
0
0

 Manage all your crypto, NFT and DeFi from one place
Securely connect the portfolio you’re using to start.


