
Solana Price Prediction: Can Hong Kong Lift SOL Back Above $100?

0
0
Can a Hong Kong stablecoin stop a month of steady selling in Solana?
Maybe, but the chart gets a vote too. This Solana price prediction weighs both, since the $SOL price already slipped under the floor flagged in an earlier support level analysis.
Two headlines landed this week, and buyers shrugged at both.
Solana Price Today: Market Snapshot at 05:36 UTC
Readings reflect 05:36 UTC on November 1, 2026, from CoinMarketCap data and CoinGlass for the longer moves.
Metric | Reading |
SOL price | $95.53 |
24-hour change | -0.59% |
7-day change | -6.48% |
30-day change | -19.22% |
24-hour volume | $1.35B |
Market cap | $56.37B |
Price barely moved on the day. But the 30-day slide tells the real story, and volume fell 59.72%, just 2.41% of market cap for the seventh-largest coin.
What Solana's Latest Posts Mean for the SOL Price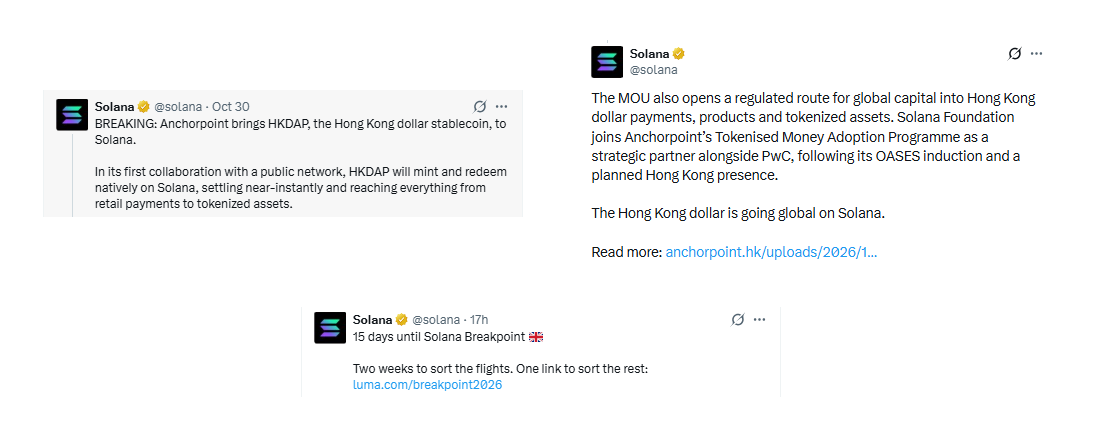
In a post from Solana, Anchorpoint brings the HKDAP stablecoin to the network, minting and redeeming natively with near-instant settlement.
A follow-up says the MOU opens a regulated route for global capital into HKD payments and tokenised assets, with the Solana Foundation joining Anchorpoint's adoption programme beside PwC.
A third post counts 15 days to Solana Breakpoint, the network's annual conference.
That's genuine adoption news. Bullish, over a long enough stretch.
But a stablecoin launch doesn't pay buyers today, and $SOL still lost 6.48% in 7 days.
Solana Technical Analysis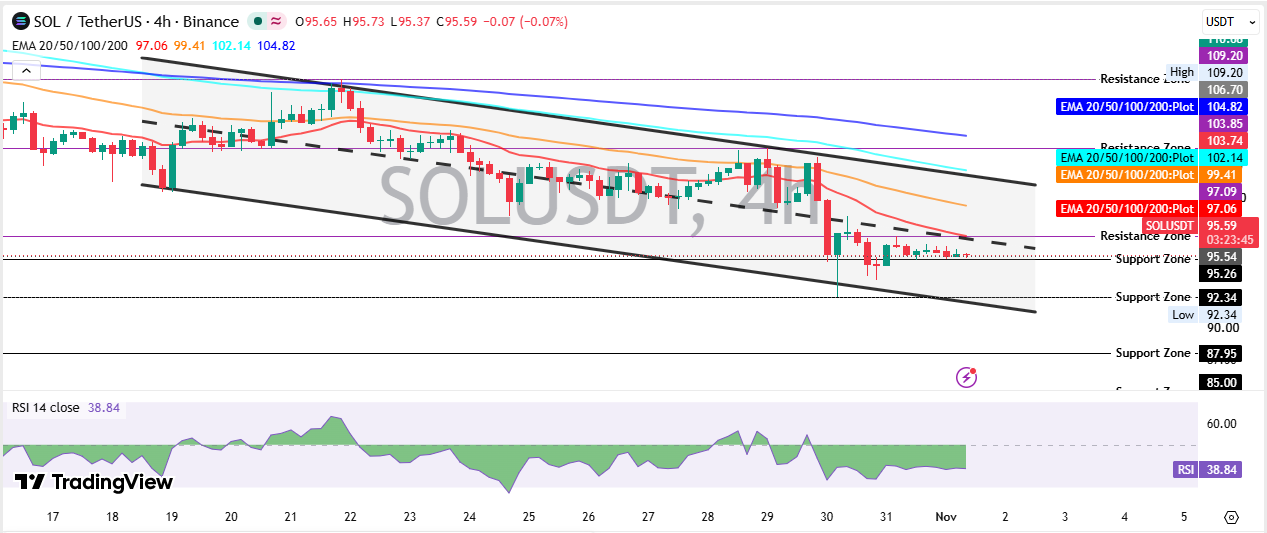
On the TradingView 4H chart, SOL/USDT trades at $95.59 inside a descending channel. This Solana technical analysis starts with the EMAs, moving averages that weight recent trades more, so they act like a sliding ceiling.
The 20 EMA sits at $97.06, the 50 EMA at $99.41, the 100 EMA at $102.14 and the 200 EMA at $104.82. Price trades under all 4.
RSI reads 38.84. Weak, though not oversold.
That leaves a single question. Whether the channel floor holds.
$SOL Support Levels: The Floor Is Under Pressure
Price is pinned. Support at $95.26 is what buyers defend right now.
Under it sits $92.34, the wick low. Then $87.95. Then $85.00.
Sellers tagged $92.34 once and buyers answered, though only just. Enough to hold the floor. Not enough to start a rally.
The October 2026 forecast treated $110 as a floor, and $SOL now trades about 13% under it.
$SOL Resistance Levels: Where Rallies Keep Stalling
The first wall is $97.06, the 20 EMA. Next come $99.41, $103.74 and $106.70, with the $109.20 high capping the channel.
That $109 area was once the $109 support zone traders defended. It's a ceiling now. And the 20 EMA has capped the recovery so far.
Solana ETF Outflows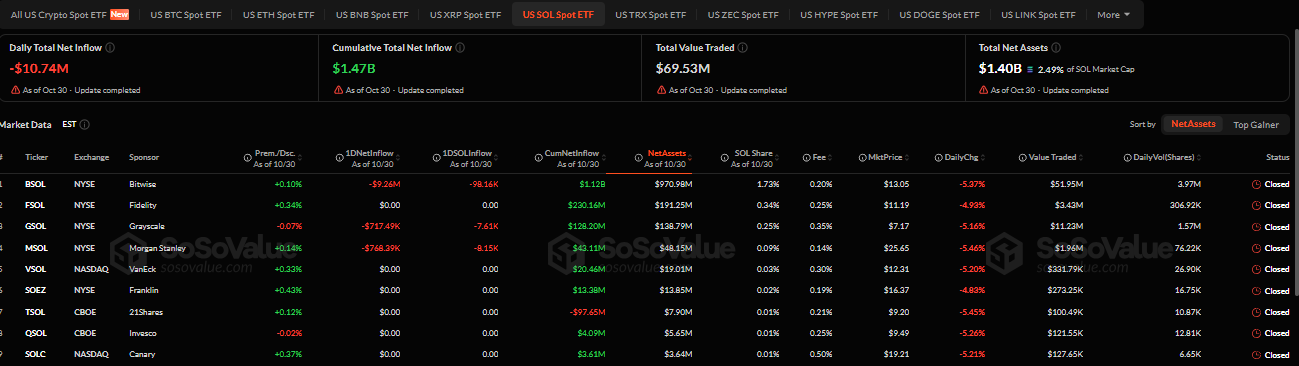
The latest SoSoValue ETF data shows Solana ETF outflows of $10.74M across US spot funds. Bitwise's BSOL led the exit at $9.26M, with Morgan Stanley's MSOL and Grayscale's GSOL each shedding under $1M.
Cumulative inflows sit at $1.47B, down from $1.58B in the earlier $109 piece, and total net assets are $1.40B.
But the outflow isn't huge. Direction matters more than size.
Futures Positioning and Liquidations
Futures volume reached $2.43B against $297.56M in spot, per CoinGlass derivatives data. That's roughly 8x the spot volume, with open interest at $5.72B.
Long/short ratios tilt long everywhere. Binance accounts read 3.1356 and OKX 3.32, while Binance top trader positions read 2.4738. So who's still betting on a bounce?
Longs took $789.78K of the $1.04M in liquidations over 24 hours. That's about 76%.
Whale Wallets: Exchanges Hold the Biggest Stacks
Solscan holder data shows the top 10 whale wallets hold 9.03% of supply, or 57.51M SOL. Binance leads with 11.89M SOL (1.87%), worth roughly $1.14B.
Both figures climbed since the last check, when the top 10 held 8.72% and Binance held 10.57M SOL. Exchange wallets store customer coins, so that isn't a dump alarm.
And a wallet tagged for a silent whale transfer holds 4.19M SOL, which deserves a watch.
Solana Price Prediction Scenarios: Bull, Base and Bear
Buy signals on SOL flashed earlier, but volume hasn't confirmed them.
SOL seems headed for another test of $92.34. Then again, a coin sitting about 3.5% above that wick low isn't broken, so the call is bearish with a short fuse.
Scenario | Trigger | Target | Invalidation | Liquidity Condition |
Bull | 4H trading above $99.41 | $103.74, then $106.70 | Trades back under $95.26 | Volume rebuilds above $1.35B, ETF inflows return |
Base | Price holds between $92.34 and $97.06 | $92.34 to $97.06 range | Trades outside that band | Volume stays near $1.35B |
Bear | 4H trading under $92.34 | $87.95, then $85.00 | Reclaims $95.26 | ETF outflows continue, long liquidations top $789.78K |
Can Solana Reach $100 or $200?
Reaching $100 needs about 4.7% from $95.53, which means flipping the 20 EMA and 50 EMA. Any Solana price prediction pointing at $109.20 needs 14.3%, a different test.
For $200, SOL needs roughly 109%, lifting market cap from $56.37B to about $118.02B. The rally to $200 case depends on ETF money coming back first.
Risks That Change the Solana Price Forecast
Any Solana price forecast starts with Bitcoin, because BTC leads altcoins, and a sharp drop drags SOL lower even with Hong Kong news on the table. Spot ETF exits could grow. And crowded longs unwind fast when the price loses $92.34.
Fresh headlines move this market quickly, so the latest crypto news updates deserve a check before any trade.
Where Does SOL Go From Here?
This Solana price prediction stays bearish while the price trades under $97.06. A 4H move above $99.41 with real volume flips that view, and a break under $92.34 opens $87.95.
What matters next is simple. Whether buyers defend $95.26 before the conference crowd arrives.
More forecasts sit in the crypto price prediction hub.
Disclaimer: This article is for informational purposes only and isn't financial advice. Levels and scenarios rely on technical chart analysis and public data at the time of writing. Crypto markets move sharply, and past patterns don't guarantee future results. Readers should do their own research before acting.
0
0

 Manage all your crypto, NFT and DeFi from one place
Securely connect the portfolio you’re using to start.


