
AAVE Price Prediction: Is the Bounce Real After the $96.60 Low?

0
0

Is the bounce from $96.60 a real turn, or a short breather before sellers return?
The AAVE price prediction today starts at $109.09. At 12:01 UTC on 16 Nov 2026, the token is up 1.99% on the day, sitting between the $103 support and $119 resistance that an earlier AAVE setup marked.
That's a recovery, not a reversal yet. This AAVE price forecast treats $114.83 as the level buyers must take and $106.01 as the one they can't lose.
AAVE Price Prediction Today Starts With the Data
Market cap sits at $1.68B, which ranks Aave as 40th on CoinMarketCap live data. Fully diluted value is $1.74B.
Volume tells the weaker story. It fell 39.04% to $188.25M, so the bounce came on thinner trading. Buyers showed up. Late, though.
Volume to market cap runs at 11.27%, enough activity to keep the chart honest. Over 24 hours the price moved between $106.01 and $110.13, a narrow $4.12 range.
Circulating supply is 15.44M AAVE out of 16M total, and no max supply is listed. And the price still trades 83.71% under the $666.86 all-time high.
Why Is AAVE Moving Today?
Short Sellers Got Squeezed
Shorts took the damage. Coinglass liquidation data shows $73.73K of short liquidations in 4 hours against $2.75K for longs. The last hour added $5.30K, all shorts.
Over 24 hours it's $168.71K in shorts and $48.04K in longs, for a total of $216.75K. But it's small money and lopsided.
Open interest, the total value of open futures bets, rose 3.14% to $274.31M. The funding rate, the periodic fee between longs and shorts, sits at 0.0019%, or 2.1% annualized. Barely positive. Longs aren't crowded.
Exchange Positioning
Binance carries the biggest futures book at $50.51M, then Gate at $49.65M and Bybit at $41.34M. Bybit shed 2.4%. MEXC jumped 51% to $20.45M, the loudest change on the board.
Futures volume dropped 40.05% to $253.97M, and WhiteBIT alone saw $10.10M leave out of $11.75M in net outflow. But Binance volume fell 46% to $85.60M, which matters more. Flows like these hit harder when a new venue enters, so exchange listing updates are worth a check.
AAVE Technical Analysis on the 4H Chart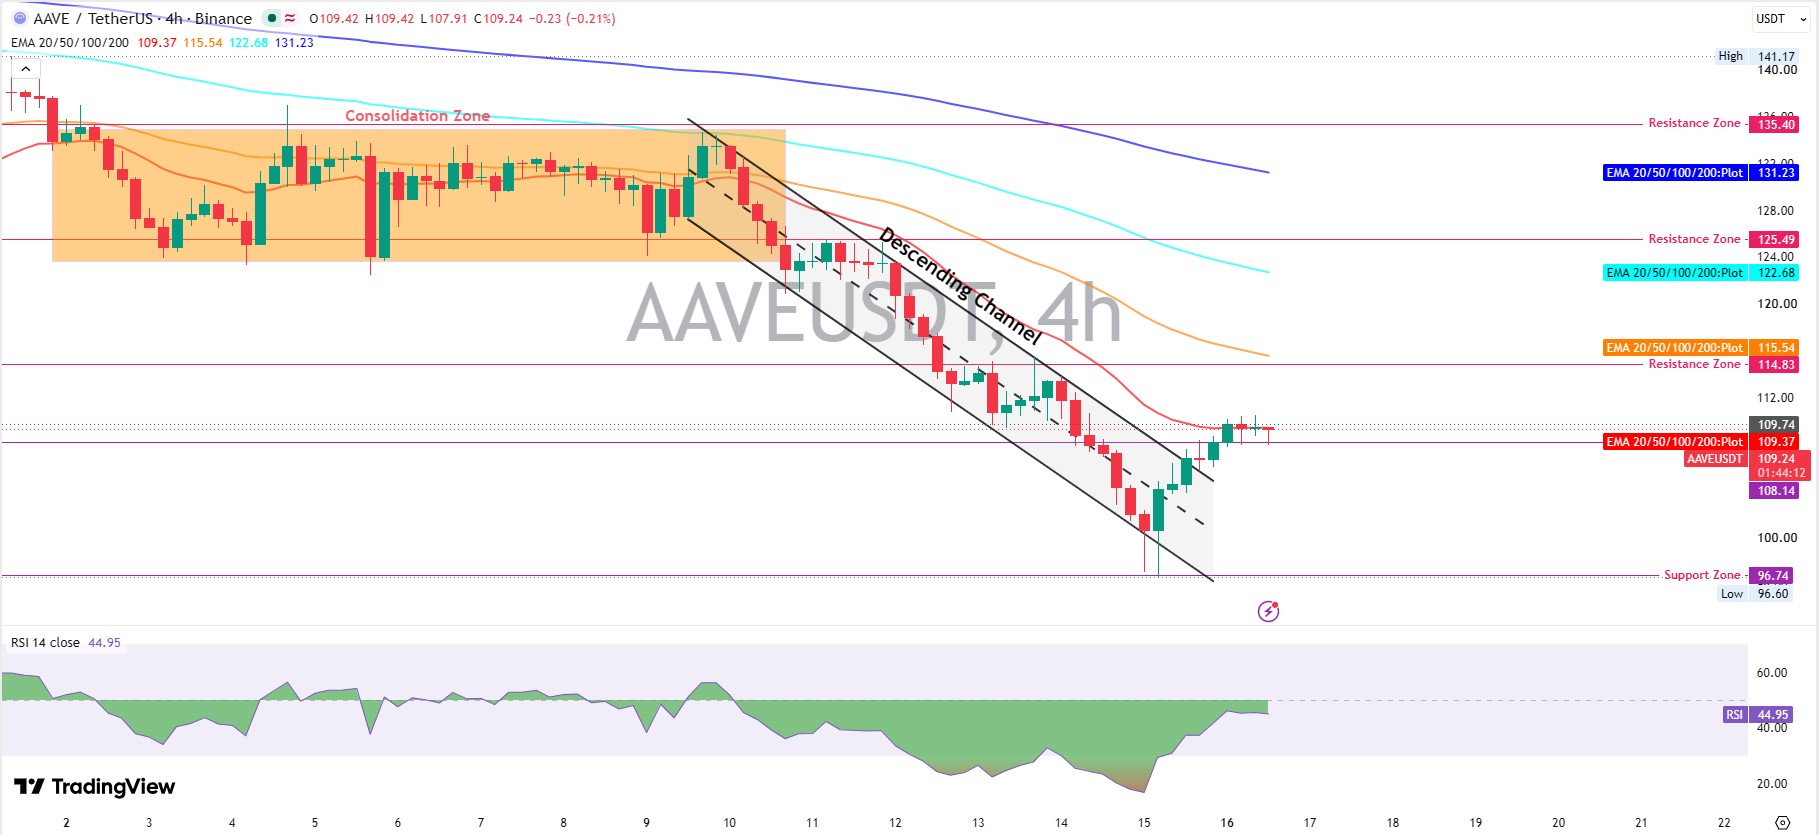
The story opens on 2 Nov 2026, and this AAVE technical analysis follows it to the latest candle. The price was sideways for 8 days inside a consolidation zone, a flat range where neither side wins, between roughly $123.50 and $135. Sellers rejected every push near $135.40 on the TradingView 4h chart, and buyers held the floor near $123.50.
That range gave way on 10 Nov 2026. Price slid into a descending channel, two sloping trendlines that guide price lower, and each bounce topped out under the last one.
The 20 EMA, an exponential moving average that weights recent candles more heavily, acted as a lid the whole way down. So did the 50 EMA at $115.54. The 100 EMA sits at $122.68 and the 200 EMA at $131.23, all stacked above price and sloping down.
Then came the flush. On 15 Nov 2026, sellers drove the price to $96.60, just under the $96.74 support zone. The long lower wick, a tail marking prices buyers rejected, tells the rest. And buyers absorbed it fast, with RSI, a 0 to 100 gauge of buying strength, dropping under 20.
The price left the channel through the top line on 15 Nov 2026. A run of green 4-hour candles took it from $96.60 to the $109 area.
At 12:01 UTC on 16 Nov 2026, the price trades at $109.24 on Binance AAVEUSDT, pinned under the 20 EMA at $109.37. RSI has climbed to 44.95, still below the 50 midline. Buyers got a bounce. They haven't earned a trend change.
Key Support Levels
$108.14 sits right under the price on the chart. Next is $106.01, the 24-hour low. Below that, $96.74 is the floor that stopped the whole slide.
Key Resistance Levels
$109.74 is the first cap, next to the 20 EMA. Then $114.83, where the 50 EMA adds weight at $115.54. Higher up sit $122.68 and $125.49, and the old range tops at $135.40.
Whale Wallets Can Swing AAVE Fast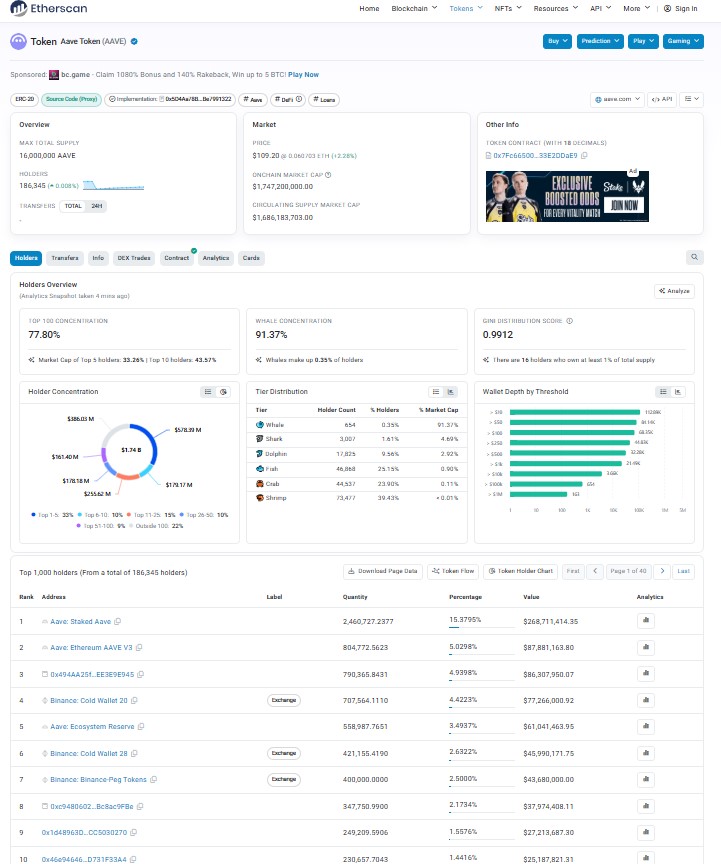
Just 654 whale wallets, 0.35% of 186,345 holders, control 91.37% of market cap, according to Etherscan holder data. The top 100 holders own 77.80%.
The staking contract holds 15.38% of supply, and Binance Cold Wallet 20 holds 4.42%. A move of that size to an exchange would hit the chart within minutes. Is a market this concentrated ever safe from a single big seller?
But the snapshot only shows balances, not who plans to sell.
Fear Weighs on the Whole Market
Coinglass puts fear and greed at 11, extreme fear. Scared markets bounce hard and fail hard. That sounds bullish for a rebound, but scratch that, because volume fell 39.04% and every EMA still slopes down.
Traders following daily crypto news should watch for a macro trigger that ends the fear before AAVE tests $114.83.
AAVE Price Forecast for the Next 30 Days
Traders comparing setups can check other price predictions across the market. This section sticks to levels on the AAVE chart.
AAVE Price Prediction If Bulls Reclaim $114.83
AAVE needs $114.83. And then a hold above the 50 EMA at $115.54. If that happens, $122.68 opens, and $125.49 becomes the next test inside 30 days.
That target needs volume well above $188.25M, and today's bounce didn't have it.
Base Case
This AAVE price projection keeps the price between $106.01 and $114.83 for the next 7 days. Buyers defend the lower end, sellers defend the 50 EMA, and neither side gets a trend.
Bear Case
A loss of $106.01 on rising volume sends the price toward the $96.74 support zone, about an 11% drop from $109, under $96.60.
Bears hold the edge today. The bearish AAVE price outlook carries more weight because every EMA slopes down and RSI sits at 44.95.
Scenario Table
Scenario | Trigger | Target | Invalidation | Liquidity Condition |
Bull | Trades above $114.83, holds $115.54 | $122.68, then $125.49 | Back under $109.37 | Volume above $188.25M |
Base | Range holds | $106.01 to $114.83 | Break of either level | Volume near $188M |
Bear | Loses $106.01 | $96.74 | Reclaims $114.83 | Rising sell volume, more long liquidations |
Risks That Can Break the Setup
Volume is the first risk. Thin trading lets $114.83 hold with little effort, and it already fell 39.04%.
Concentration is the second. Whales hold 91.37% of market cap, so one wallet can reset the chart.
And Fear and Greed at 11 adds pressure to every level. Risk appetite in smaller tokens is easy to track through memecoin market news.
Where AAVE Goes From Here
Bearish below $114.83. That's the stance, and this AAVE price analysis backs it with falling EMAs, thin volume, and RSI at 44.95. A move above $114.83 on rising volume flips the near-term chart to bullish toward $122.68. A loss of $106.01 reopens $96.74.
Disclaimer. This article is for information only and isn't financial advice. Crypto prices swing fast, and no level or scenario here is guaranteed. Do your own research and never risk money that can't be lost.
0
0

 Manage all your crypto, NFT and DeFi from one place
Securely connect the portfolio you’re using to start.


