
After the Brutal Flash Crash, Is XRP’s Next Big Move a Trap or a Turnaround?

0
0
After the brutal flash crash, XRP’s next big move is still unclear. On 22 August 2026, XRP fell 37%, or about $0.60, within minutes.
Roughly $500 million in leveraged long positions were wiped out. Two months later, the market is split on what comes next.
What Happened in the August Crash?
The crash was part of a wider $1.35 billion liquidation event, Coinglass data shows, mostly on Binance.
It followed a rally of more than 60% in one week, which pushed XRP toward $1.69. Crowded longs and thin weekend liquidity made the drop worse.
No clear news triggered it. XRP recovered toward $1.50 within hours, and Bitcoin, Ethereum, and Solana also fell.
Do the Signals Point to a Turnaround or a Trap?
Both sides have evidence. Bulls point to a leverage reset, since Binance XRP open interest fell 15.8% in October. Dip buyers also placed $184M in taker buys on Binance.
Cumulative US spot XRP ETF inflows sit near $1.8B, and on-chain use is rising, as XRP Ledger RWA transfer volume hit $7.03B.
Bears point to supply. Exchange reserves hit 11.81 billion XRP, a 99th percentile reading, though proof of reserves is not proof of solvency.
ETF flows also turned negative last week. Macro risk adds weight, as Bitcoin was already defying two macro headwinds from the dollar and Treasury yields.
Reading the Weekly Chart
At 09:34 UTC on 21 October 2026, XRP traded at $1.3656. That is up 2.32%, or $0.0310, on the weekly XRPUSD chart. The Parabolic SAR dots sit below price, near $1.08, which keeps the trend bullish.
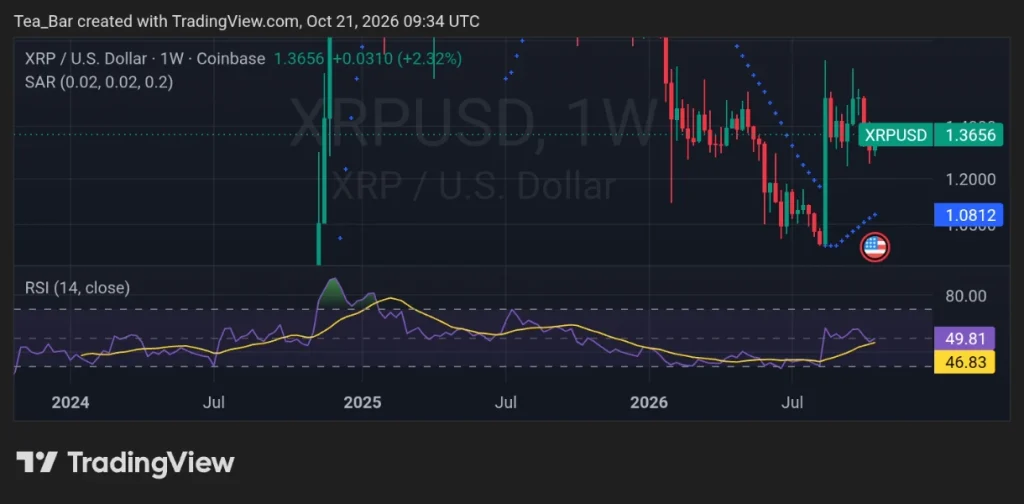
The RSI reads 49.81, above its average of 46.83. That is a neutral reading with slight upward momentum. The weekly candles show long upper wicks near $1.70 from the August spike.
The previous weekly candle shows a lower wick near $1.25. Buyers defended that zone, but sellers still cap rallies near $1.40.
What Would Settle the Debate?
A weekly close above $1.40 would favor the turnaround case. A drop below $1.25 would favor the trap case.
Reserves, ETF flows, and leverage will move in between. The August crash cleared the crowd, and it remains to be seen who builds the next one.
Disclaimer:
This article is for informational purposes only and does not constitute financial, investment, or trading advice. The views expressed are based on publicly available data, market observations, and the author’s interpretation at the time of writing. Cryptocurrency markets are highly volatile and unpredictable, and past performance or current technical setups do not guarantee future results. Readers should conduct their own research and consult with a qualified financial advisor before making any investment decisions. TechGaged does not accept liability for any losses incurred based on the information presented.
The post After the Brutal Flash Crash, Is XRP’s Next Big Move a Trap or a Turnaround? appeared first on TechGaged.
0
0

 Manage all your crypto, NFT and DeFi from one place
Securely connect the portfolio you’re using to start.


