
Dogecoin Price Prediction: Can DOGE Hold the $0.06427 Support?

0
0

Where does the Dogecoin price go next after a 13% price drop? The next daily candles will pick the side.
This Dogecoin price prediction begins with DOGE trading near the low of the day and well under its 50-day average price. Earlier coverage of whales adding DOGE told the buyer side of the story. The chart still shows sellers in charge.
Dogecoin Price Forecast: 24-Hour Market Snapshot
CoinGecko market data places DOGE at 12th by market cap, with the price near the bottom of the day's range. FDV, or fully diluted valuation, counts future supply too, and with no max supply, it sits almost level with market cap.
Metric | Value |
Price | $0.06705 |
7-day change | -13.0% |
24-hour range | $0.06652 to $0.06939 |
Market cap | $10.502B |
Market cap rank | 12th |
FDV | $10.503B |
24-hour volume | $472.886M |
Circulating supply | 156.707B DOGE |
Source: CoinGecko, captured Nov 12, 2026, 09:46 UTC.
Volume of $472.886M equals about 4.50% of market cap, a moderate turnover. And a bounce needs fresh buyers, since sellers are winning.
Dogecoin Support Levels: Price Sits 4.17% Above $0.06427
Across seven days, DOGE is down 13.0%, per CoinGecko's 7-day chart, about $0.01 below where it traded a week ago.
The nearest support level on the chart is $0.06427, which sits 4.17% below the price. For this Dogecoin price prediction, the $0.07424 resistance level, a price where sellers have held before, is 10.69% above, so the downside test is nearer.
Dogecoin ETF Flows: $15.05M Cumulative Flow
The latest US spot ETF figures from SoSoValue Data show a $0.00 daily net inflow. Cumulative net inflow, the running total of all days, stands at $15.05M.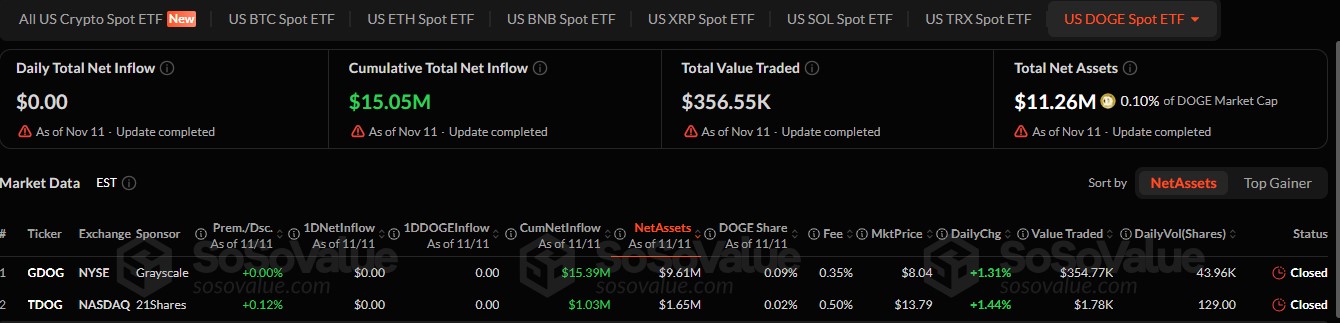
Source: SoSoValue ETF data as of Nov 11, 2026, captured Nov 12, 2026, 09:46 UTC.
The two funds hold $11.26M in net assets, the combined value of everything they own, or 0.10% of DOGE market cap. Updates in the latest crypto news can change that picture quickly. Flat ETF flows add no buy pressure. But outflows would add sell pressure as funds sell DOGE.
Dogecoin Price Prediction and Holders: Top 10 Hold 44.63%
Dogechain's holder data shows the top 10 addresses hold 44.63% of spendable DOGE. The next 90 lift the share to 66.13%.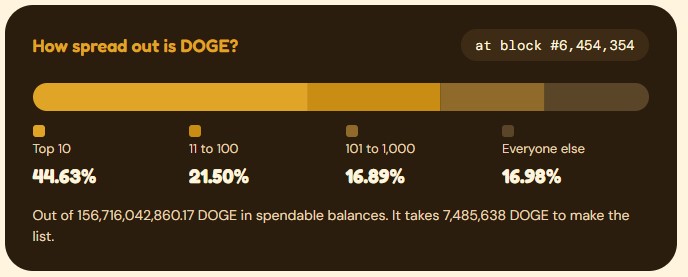
Source: Dogechain rich list at block #6,454,354, captured Nov 12, 2026, 09:46 UTC.
Ten wallets controlling 44.63% means one large transfer to an exchange could add sell pressure fast. Everyone outside the top 1,000 wallets holds just 16.98%.
Dogecoin Liquidation Data: Longs Take 89% of $3.84M Wipeout
Longs, the traders betting on a rise, got hit hard. CoinGlass liquidation data shows $3.84M in forced exits over the last day, and longs took 89% of it. A liquidation happens when an exchange forces out a trade made with borrowed money.
Window | Total | Longs | Shorts |
1 hour | $364.59 | $364.59 | $0.00 |
4 hours | $65.85K | $33.44K | $32.41K |
12 hours | $3.49M | $3.41M | $82.19K |
24 hours | $3.84M | $3.42M | $421.20K |
Source: CoinGlass, captured Nov 12, 2026, 09:46 UTC.
Only $65.85K hit in the latest 4 hours, against $3.49M over 12 hours. Forced long exits add sell orders and push the price down, but the slowdown points to a cooling flush.
Dogecoin Open Interest: $922.69M Spread Across Exchanges
Open interest is the total value of futures positions still open. CoinGlass futures data puts DOGE open interest at $922.69M, by Binance at $212.96M.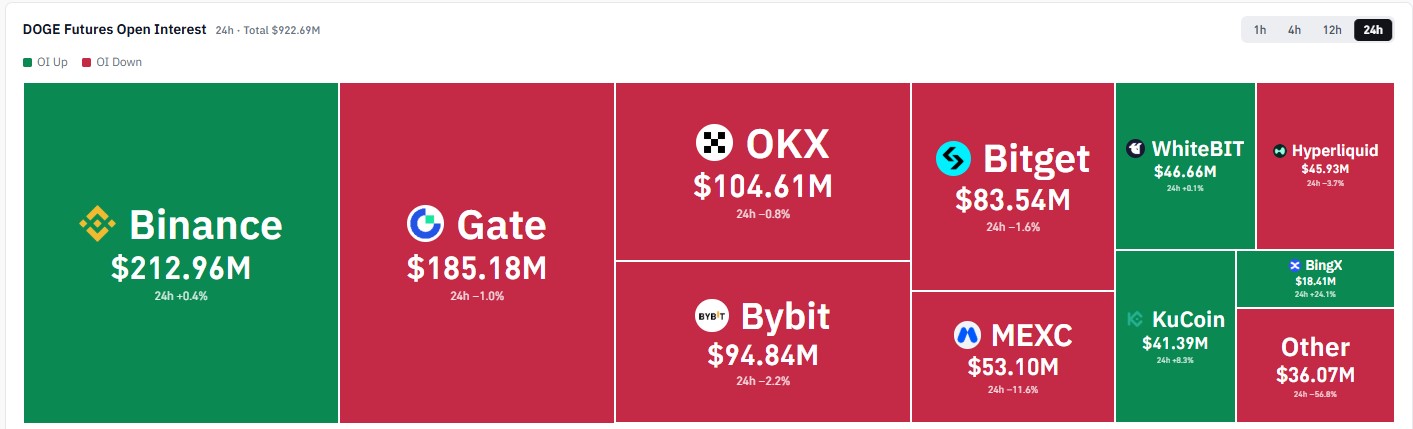
Source: CoinGlass DOGE futures open interest, 24h, captured Nov 12, 2026, 09:46 UTC.
Futures volume, the value traded in those contracts, totals $858.16M over the day, with Binance at $274.67M and OKX at $146.98M.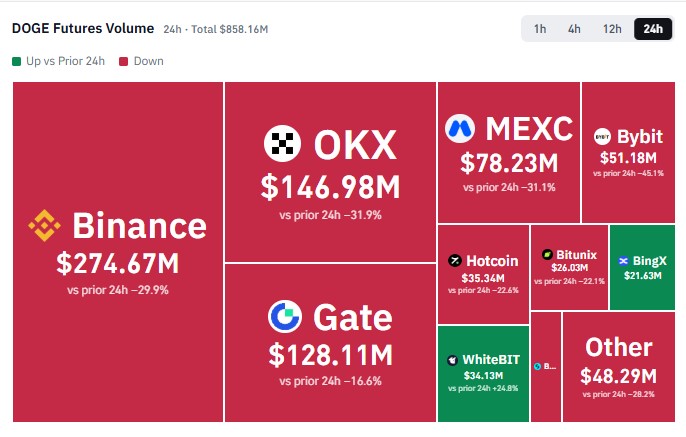
Source: CoinGlass DOGE futures volume, 24h, captured Nov 12, 2026, 09:46 UTC.
Volume fell on most exchanges, with Bybit down 45.1%, which first reads as fading interest. Open interest barely moved. Steady open interest during a drop means positions are being kept, so a sharp move could trigger more liquidations.
Dogecoin Technical Analysis: 50-Day EMA and RSI Levels 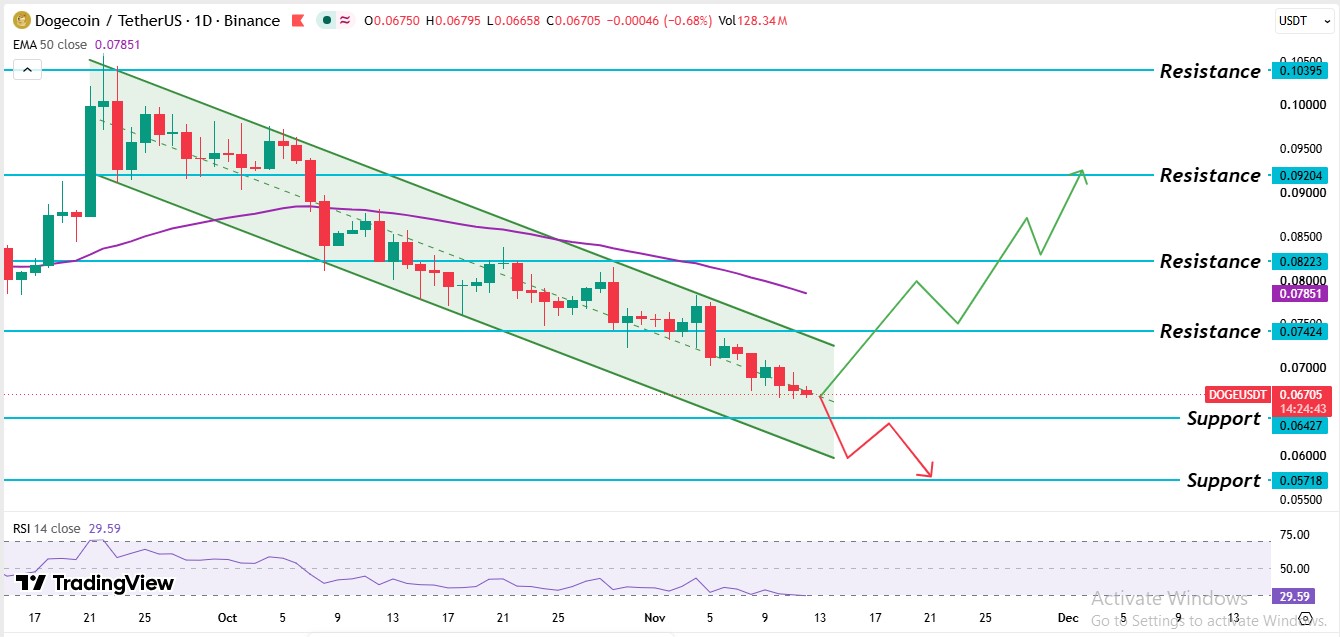
Source: TradingView, DOGE/USDT 1D chart with EMA 50 and RSI 14, captured Nov 12, 2026, 09:46 UTC
The Binance 1D chart for DOGE/USDT on TradingView frames this Dogecoin price prediction. A September rally pushed DOGE up to the $0.10395 resistance level before sellers took control.
After the peak, the price slid lower inside a falling channel, a band of lower highs and lower lows between two sloping lines. In early October, a daily candle traded under the 50-day EMA, a trend line that averages the last 50 days of prices.
A long red candle then pushed the price under the $0.07424 resistance level, where sellers have held. A 4H pin bar reversal, a candle with a long rejection wick, from the $0.06427 support level would be the first sign of a bounce. Right now, DOGE trades below the $0.07424 resistance level and the EMA and above the $0.06427 support level, where buyers need to step in.
The $DOGE 50-day EMA sits at $0.07851, where sellers have defended. DOGE's $0.06705 price trades 14.57% below it, and the latest daily candle trades below it too. The $0.07424 resistance level sits just under it, so recovery needs a daily candle trading above both levels.
The $DOGE RSI reads 29.59 on the 14-day setting. RSI,Under 50 means sellers hold the edge, and under 30 means selling has gone too far, so a bounce is possible.
Dogecoin Support and Resistance Levels
Level | Type |
$0.10395 | Resistance level |
$0.09204 | Resistance level |
$0.08223 | Resistance level |
$0.07851 | 50-day EMA |
$0.07424 | Resistance level |
$0.06427 | Support level |
$0.05718 | Support level |
Distances are measured from the $0.06705 price. The nearest levels are $0.07424 above and $0.06427 below.
Dogecoin Price Forecast: Bull, Base, and Bear Scenarios
Scenario | Trigger | Target | Invalidation |
Bull | Daily candle trades above $0.07424 | $0.07851 EMA level than $0.08223 | Daily candle back below $0.07424 |
Base | Price stays between $0.06427 and $0.07424. | Sideways trade inside that range | Daily candle breaks either level. |
Bear | Daily candle trades below $0.06427 | $0.05718 | Daily candle trades above $0.07424 |
Regulatory delay is the outside risk. ETF flows could turn from flat to negative, adding sell pressure near the $0.06427 support level. And a daily candle trading below that level voids the base case.
Dogecoin Price Prediction: Expert Outlook
The condition to watch is a daily candle trading above $0.07424. That would turn a bounce into a recovery attempt toward the EMA, and anything less leaves sellers in control.
Disclaimer: This article is for information only and isn't financial advice. Traders should do their own research and risk only what they can afford to lose.
0
0

 Manage all your crypto, NFT and DeFi from one place
Securely connect the portfolio you’re using to start.


