
Chainlink Price Prediction November 2026: Can LINK Rebound?

0
0

Can Chainlink hold its last support shelf before November begins?
LINK traded at $11.46 at 10:08 UTC on October 26, 2026, up 1.34% in 24 hours. A small bounce. A bigger problem sits behind it, because the 30-day loss still stands at 17.48%.
This Chainlink price prediction November 2026 stays bearish until buyers reclaim $12.288, and the earlier oversold breakdown call pointed at the same weakness.
The Chainlink price today also sits just under its 100-day moving average at $11.529. That line matters.
Chainlink Price Today: Market Data Snapshot at 10:08 UTC
CoinMarketCap data ranks LINK 13th, with an $8.57B market cap and $208.51M in 24-hour volume. Volume fell 16.47% from the prior day and equals just 2.41% of market cap.
Circulating supply is 748.09M of the 1B maximum, which puts fully diluted value at $11.46B.
Why Is LINK Under Pressure Before November?
Sellers have had the calendar. LINK is down 4.49% over 7 days, though a 90-day gain of 37.34% proves dip buyers have shown up before.
Derivatives are driving the tape. CoinGlass liquidation data shows longs lost $194.31K in 24 hours against $28.44K for shorts, while futures volume of $271.19M dwarfs $54.26M in spot trading.
Bitcoin is flat at $80,326.08 at 10:08 UTC, up 0.11% in 24 hours, with volume down 2.75% to $18.49B. US spot Bitcoin funds recorded $137.94M in net outflows on October 23, 2026 UTC. But altcoins rarely rally without Bitcoin leading.
Chainlink Technical Analysis: Can the 200 EMA Hold the Line?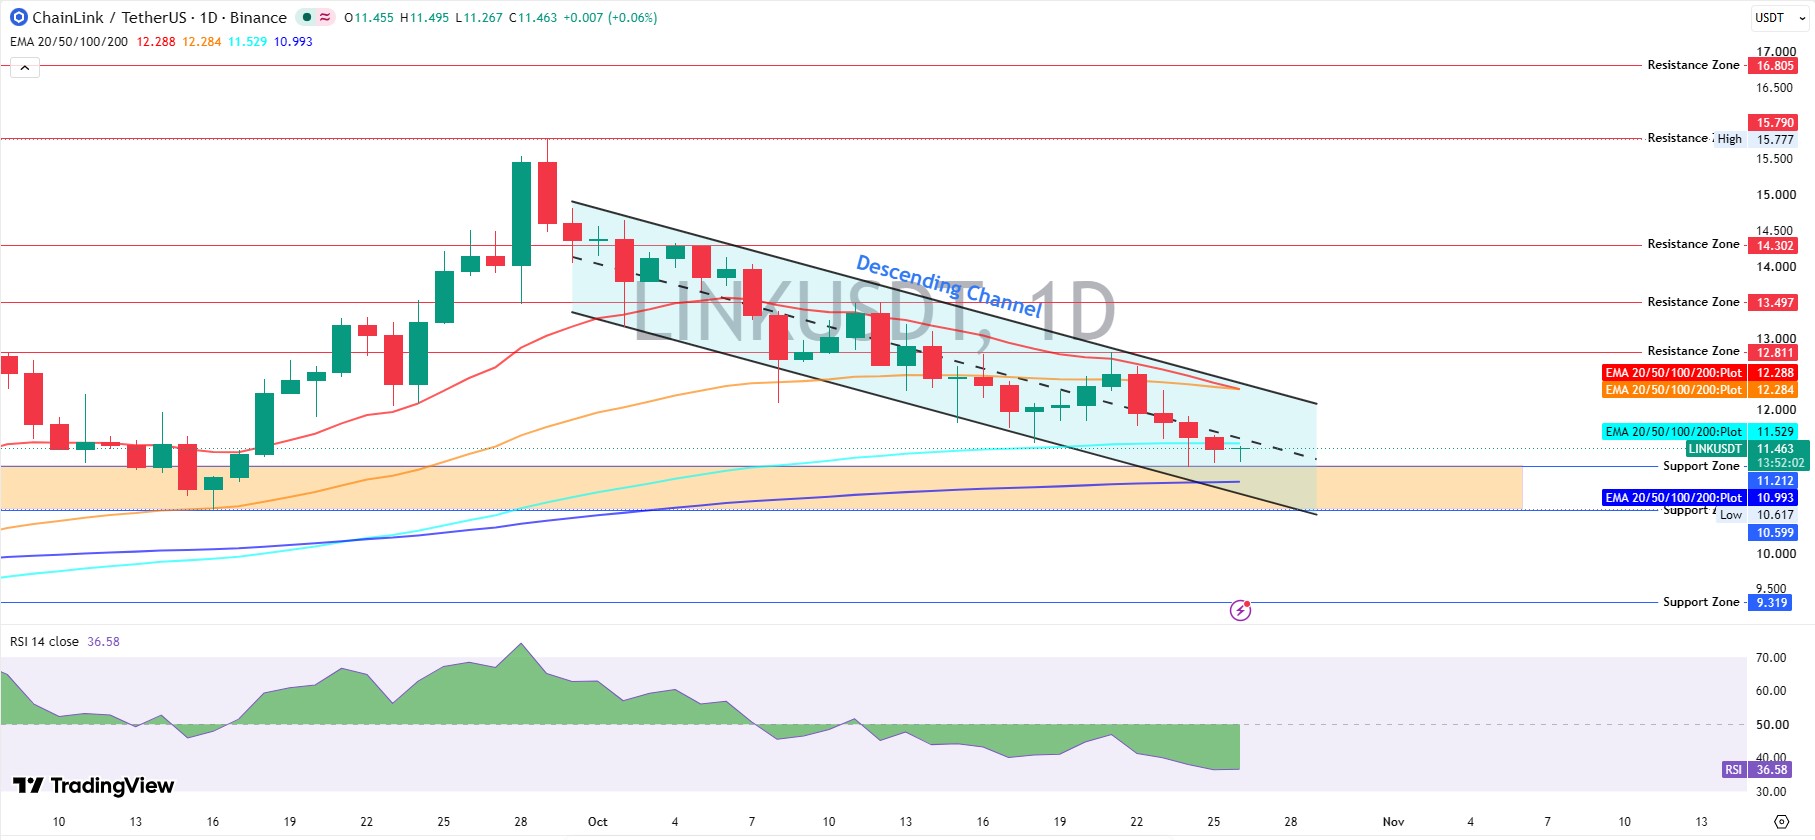
Is LINK Showing Bearish or Bullish Momentum?
This Chainlink technical analysis starts with the TradingView daily chart, where LINK slid into a descending channel after a run to a $15.777 swing high. A descending channel is a pair of falling trendlines in lower highs.
RSI reads 36.58. Under 50 means sellers lead. Above 30 means the slide isn't washed out yet.
EMAs, moving averages that weight recent trading more, add detail. The 20 EMA at $12.288 and the 50 EMA at $12.284 sit overhead, the 100 EMA at $11.529 hugs the price, and only the 200 EMA at $10.993 sits below.
At first glance, the near-touching 20 and 50 EMAs read like a squeeze. Scratch that. Both slope down, so it's resistance, not coiling.
Which LINK Support and Resistance Levels Matter Most?
These LINK support and resistance zones frame the month. Support, where buyers tend to step in, starts at $11.212, the top of the orange demand zone, then $10.599. A deeper floor sits at $9.319.
Resistance, where sellers tend to appear, stacks at $12.811, $13.497, $14.302, and $15.777. The $12.47 level from an earlier channel breakout setup sits in the gap before the first of those.
A daily trade above $12.811 on rising volume confirms a breakout. And a daily trade under $10.599 breaks the whole demand zone.
Chainlink Price Prediction November 2026
In this Chainlink price prediction November 2026, the base case carries the most weight, and none of the paths is guaranteed.
Scenario | Trigger | Target | Invalidation | Liquidity Condition |
Bearish | Daily trade below $11.212 | $10.599, then $9.319 | Daily trade back above $11.529 | Thin bids, weak volume |
Base | Trades hold inside the range | $11.212 to $12.288 | Break of either edge on volume | Volume steady, ETF flow flat |
Bullish | Daily trade above $12.811 | $13.497, then $14.302 | Daily trade back below $11.529 | Rising volume, ETF inflows return |
Bearish Scenario: Can $LINK Fall Further?
Bears need a single trigger, a daily trade below $11.212. That breaks the orange zone and points to $10.599.
The 200 EMA at $10.993 sits 4.1% lower and acts as the first speed bump.
Sellers already drove an earlier leg of this slide, which the market dip outlook covers.
Base Scenario: Can $LINK Stabilize?
A range between $11.212 and $12.288 fits best. RSI holding between 30 and 50, steady volume and an intact 200 EMA would all support it.
Dip buyers behind the reserve buy bounce would need to return near $11.212.
Bullish Scenario: Can $LINK Recover?
Recovery begins with a daily trade above $11.529, then $12.288, where the 20 EMA and 50 EMA meet. And $12.811 is the real test.
Anyone asking can LINK reach $13; it needs $12.811 to give way first.
Fresh headlines like the Japan Fulcrum news could add fuel. But a daily trade back below $11.529 ends the bullish case.
What Can Drive Chainlink Price November 2026?
Adoption Keeps Growing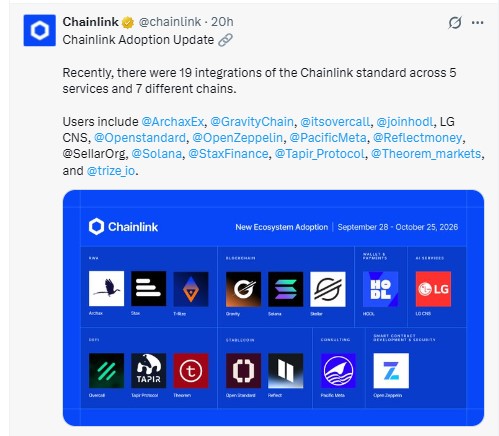
Chainlink's adoption update counts 19 integrations across 5 services and 7 chains between September 28, 2026 and October 25, 2026 UTC. Users include Archax, OpenZeppelin, and Stax Finance.
ETF Flows Have Gone Quiet
SoSoValue ETF data shows daily net inflow at $0 on October 23, 2026 UTC, the 5th flat session in a row. Net assets of the two US spot ETF funds slid to $211.08M, or 2.36% of $LINK market cap.
So who funds the next leg higher?
Whale Wallets and Supply Concentration
Etherscan holder data counts 915,550 holders. Whale wallets, meaning very large balances, number 4,012 and control 90.54% of supply.
But several top addresses carry noncirculating labels, so a large balance isn't always a sell order.
What Can Stop LINK From Recovering in November?
A daily trade under $11.212 hands them control.
Rejections matter too. Another failure at $12.288 keeps the descending channel intact. And the whale holders analysis explains why concentrated supply adds sudden-selling risk.
Final Outlook: LINK Price Prediction
The LINK price prediction stays bearish below $12.288, with $11.212 and $10.599 as the downside levels to watch.
A daily trade above $12.811 on rising volume would confirm a bullish turn, while a reclaim of $11.529 is the first sign sellers are losing grip.
Thin volume and flat ETF flows are the main risks to this Chainlink price prediction November 2026. More coin setups sit in the crypto price predictions.
Disclaimer: This article is for informational purposes only and isn't financial advice. Crypto prices are volatile, and targets aren't guaranteed. Research independently before trading.
0
0


 Manage all your crypto, NFT and DeFi from one place
Securely connect the portfolio you’re using to start.


