
XRP Price Crash Continues: XRP Loses $1.30 Support, Here Is the Next Target

0
0

$XRP has followed Bitcoin off a cliff. After grinding sideways around $1.30 for most of October, XRP broke down on October 29 and 30, sliding from $1.32 to a low of $1.21 in under 36 hours. At the time of writing, XRP trades at $1.247, down roughly 5% on the week and below the $1.30 level that had absorbed every dip since October 14.
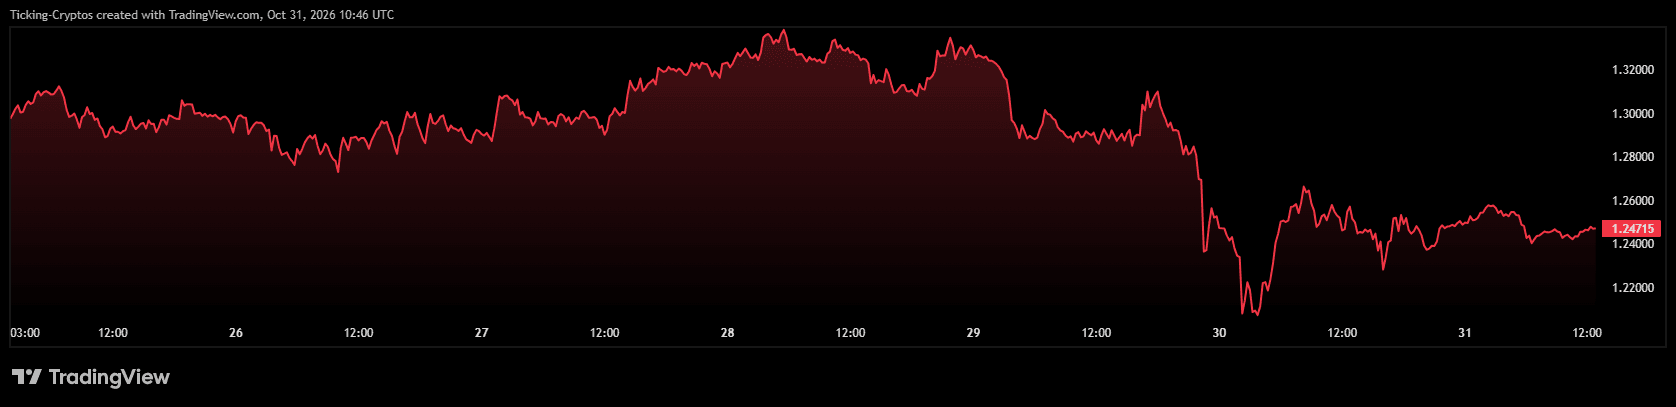
The seven-day chart tells the story clearly. A first leg down on October 29 took XRP from $1.32 to $1.28, the bounce failed at $1.31, and a second leg on October 30 cut straight through $1.30 and wicked down to $1.21. The recovery since then has stalled at $1.26, well short of reclaiming the broken level.
Why Did XRP Price Crash Below $1.30?
The $1.30 line (orange on the daily chart) had been the floor of the October consolidation. XRP tested it on October 14, 16, 21, 24 and 27, and every time buyers stepped in. This week, two daily candles closed below it in a row, and the October 30 wick to $1.20 shows how thin demand has become underneath.
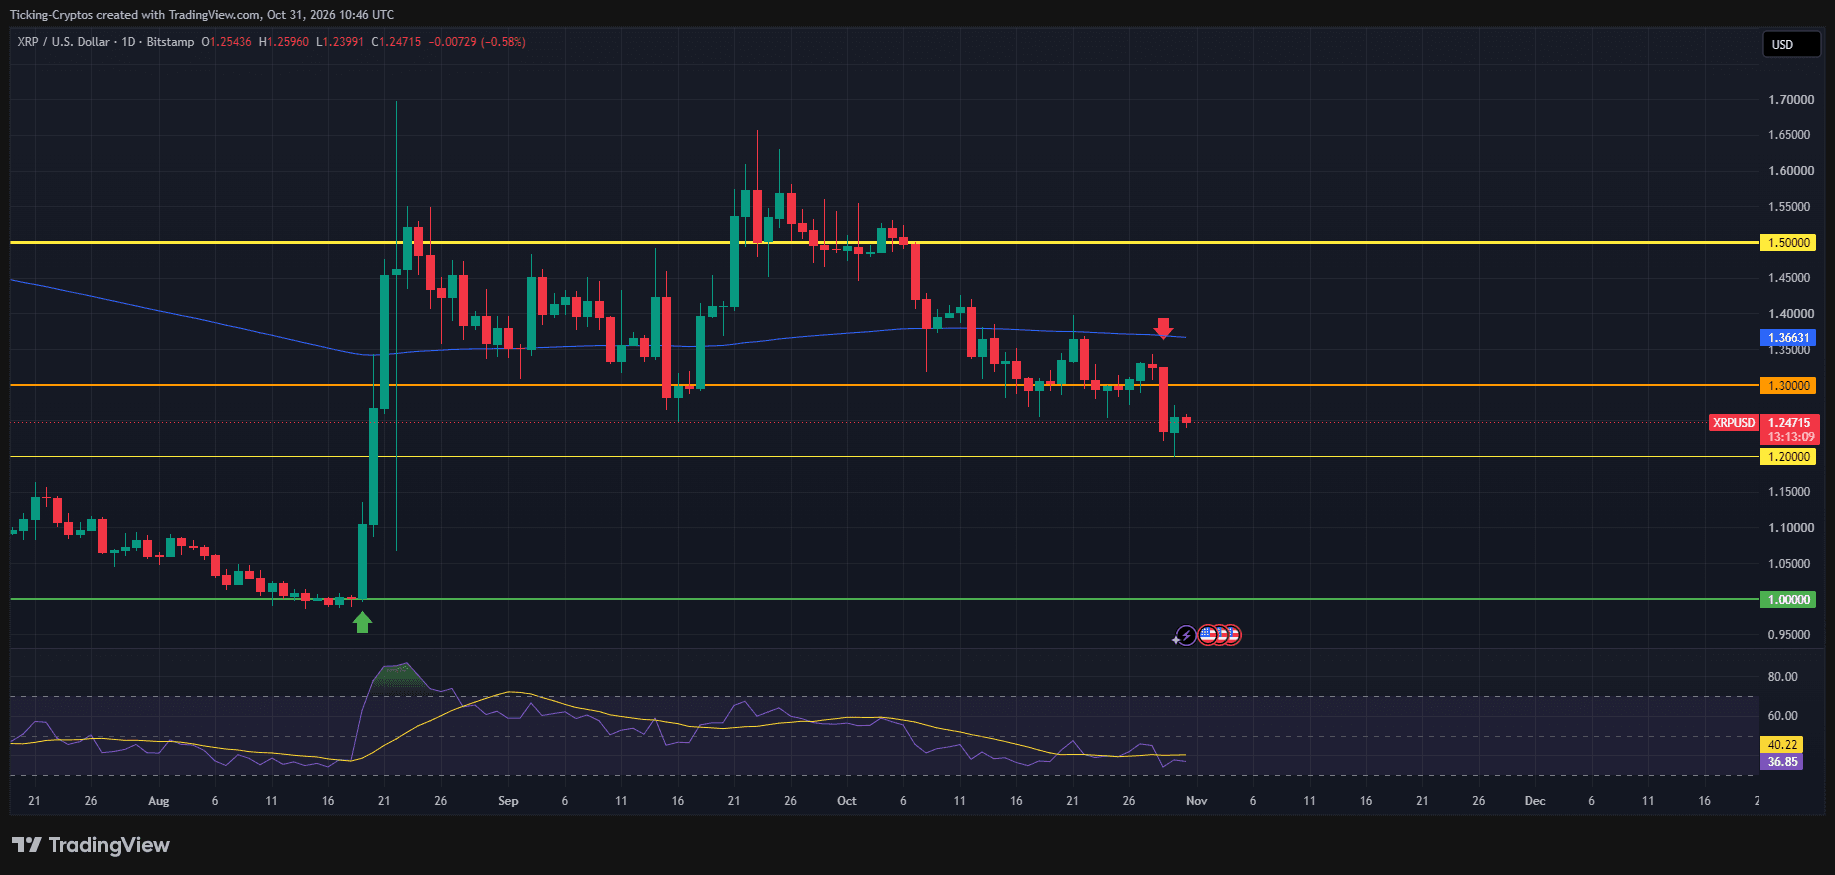
The bigger picture had been deteriorating for weeks. XRP topped at $1.65 on September 23, then printed a series of lower highs: $1.55 in early October, $1.40 in mid-October, and $1.35 on October 23. The daily moving average (blue line) at $1.366 has flattened out and now sits above price, acting as dynamic resistance. The daily RSI reads 37, below its signal line at 40 and just a few points away from oversold territory, which confirms the downside momentum.
XRP Price Analysis: Where Is Support Now?
With $1.30 lost, the chart offers two clear levels below current price:
- $1.20: the yellow support line that caught Friday’s wick. This is where the August 20 breakout candle launched from, and it is the last horizontal level before the structure thins out.
- $1.00: the green line marking the August lows and the psychological round number. Between $1.20 and $1.00 there is almost no established support on the daily chart, which means a break of $1.20 could move fast.
On the upside, XRP needs to close back above $1.30 to turn this into a failed breakdown. Above that, the moving average at $1.366 is the next hurdle, followed by $1.40 and the $1.50 level that capped price in early October.
XRP Price Prediction: Here Is the Next Target for XRP
- Bearish scenario (more likely): XRP fails to reclaim $1.30 and retests the $1.20 support. The next target is $1.20, about 4% below current price. If that level breaks on a daily close, the next stop is $1.10 and then the $1.00 round number, a decline of roughly 20% from today’s price and a full retrace of the August rally.
- Bullish scenario: Buyers defend $1.20 again and push XRP back above $1.30 within the next few sessions. That would trap the late sellers and open a move toward the moving average at $1.366, then $1.40. The RSI near 37 leaves room for a relief bounce, but as long as XRP trades below $1.30 and below its moving average, rallies remain sell-the-rip opportunities rather than trend changes.
What Should Traders Watch Next?
Three things matter now: whether XRP can close a daily candle back above $1.30, whether the $1.20 support holds a second test, and whether Bitcoin stabilizes above its own key levels. XRP has moved almost one-to-one with BTC this week, so a deeper Bitcoin correction would likely drag XRP toward $1.00.
Track the live XRP price and other major coins on our crypto prices page.
0
0

 Manage all your crypto, NFT and DeFi from one place
Securely connect the portfolio you’re using to start.


