
Crypto Market Bloodbath: Are Fed Rates and US Midterms Behind It?

0
0

The Crypto Market is trading near $2.68 trillion after another rejection from the top of its falling channel. Bitcoin is just above $80,000, down 1.20%. Ethereum is under $2,400, down 1.00%.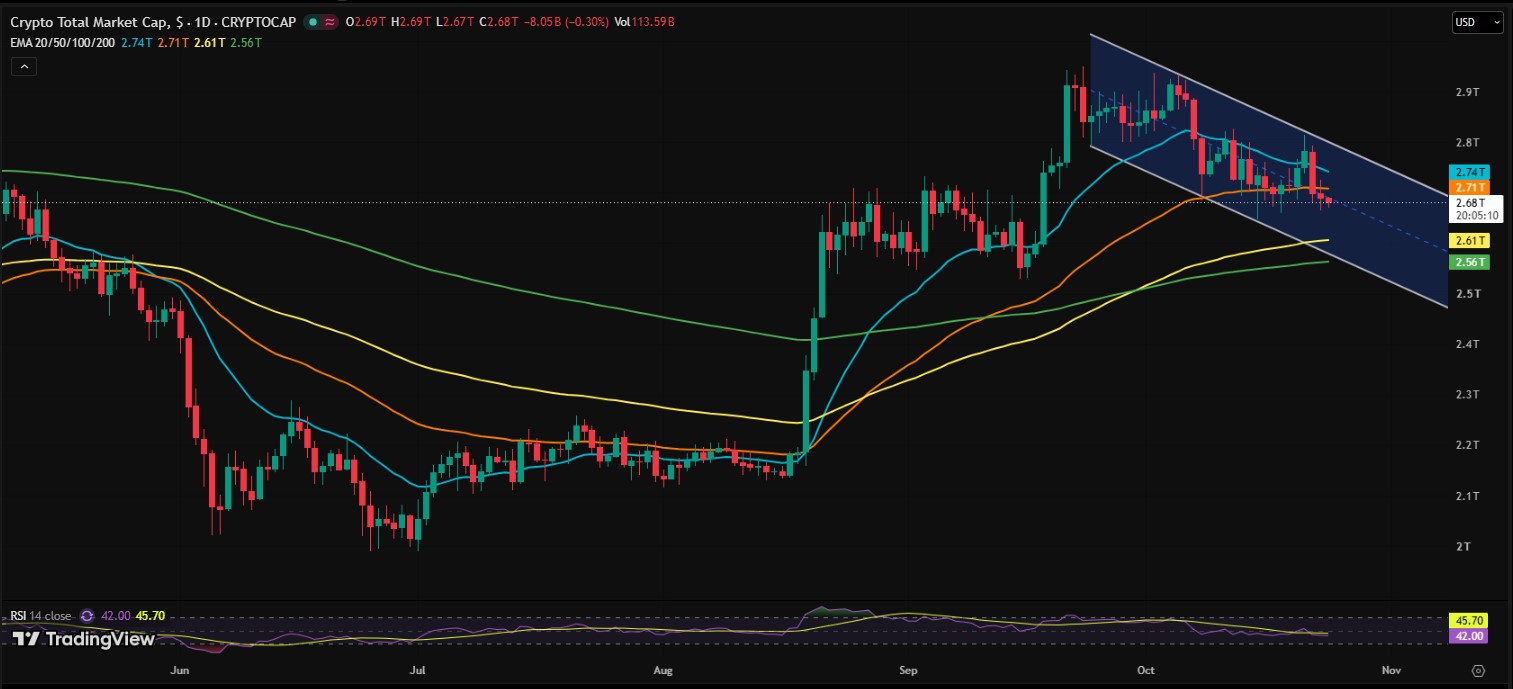
XRP is down 2.33% and trades around $1.29. The Fed decision and the US midterm elections are close, and traders are cautious.
Why Is the Crypto Market Down Today?
Stocks set the tone. The S&P 500 fell 0.46%, and the Nasdaq 100 dropped 1.53%. Both closed the week at their lowest level in three months.
Oil added to the stress. Brent crude jumped above $117, its highest since March 2026, and that brings fresh inflation worries. Concerns over AI spending and debt also hit tech shares.
On the daily chart, total market cap sits below its 20-day and 50-day EMAs. That points to sellers still being in charge for now.
Total Market Cap Level | Value |
Current | $2.68T |
20-day EMA | $2.74T |
50-day EMA | $2.71T |
100-day EMA | $2.61T |
200-day EMA | $2.56T |
RSI (14) | 42.00 |
The 100-day and 200-day lines are the next support areas.
CZ also posted that "bitcoin is dead" has been said many times before. In his view, those were often good buying moments. It is one opinion, not a signal.
Why Is Bitcoin Down Today? Will It Fall Below $80,000?
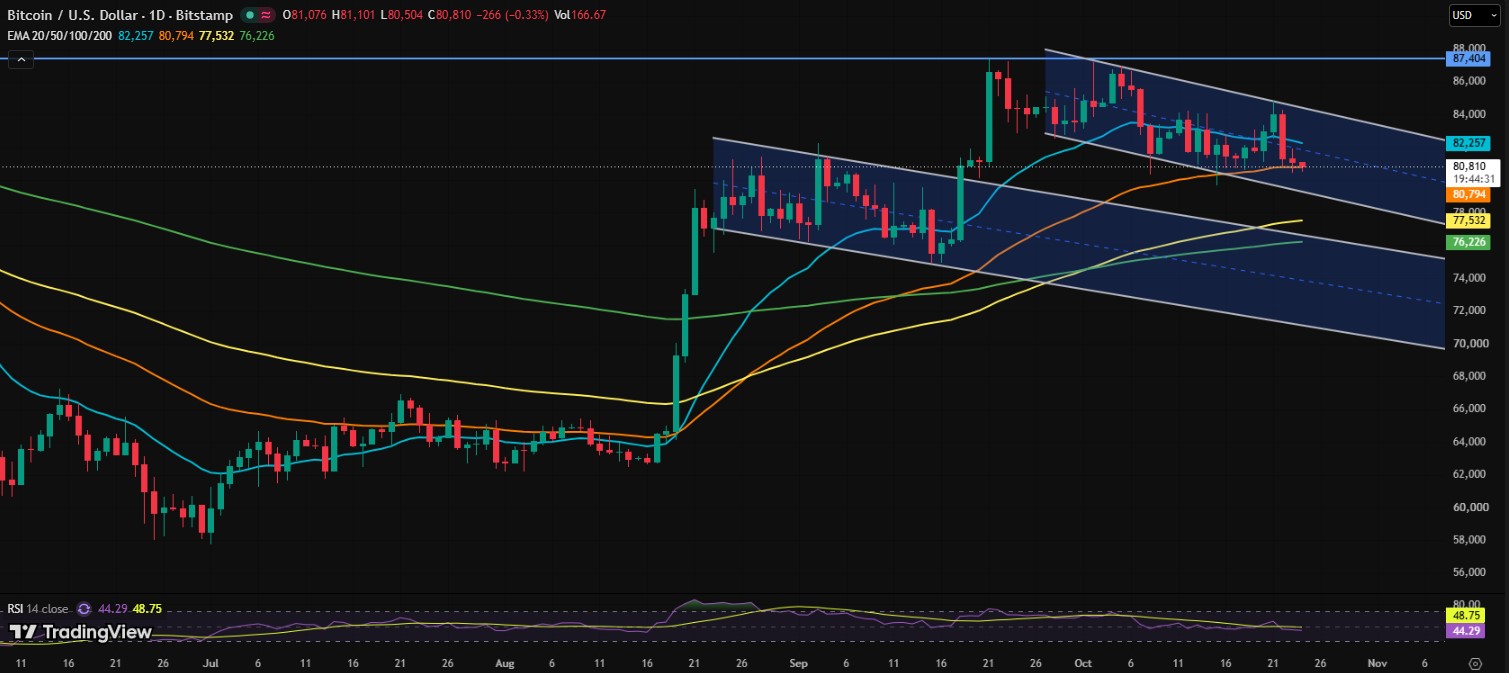
Not yet, but the risk is real. Bitcoin trades near $80,810 inside a descending channel. It sits below the 20-day EMA and right at the 50-day EMA. RSI is near 44, so selling pressure is there, but the coin is not deeply oversold.
If BTC breaks the $80,000 to $79,000 zone, the next stops could be $77,500 and $76,000. If buyers hold and push above $82,300, a move toward $84,000 to $85,000 is possible. Stronger resistance is near $87,400.
BTC Level | Value |
20-day EMA | $82,257 |
50-day EMA | $80,794 |
100-day EMA | $77,532 |
200-day EMA | $76,226 |
Support | $80,000 to $79,000 |
Resistance | $82,300, then $87,400 |
Why Is Ethereum Going Down Today?
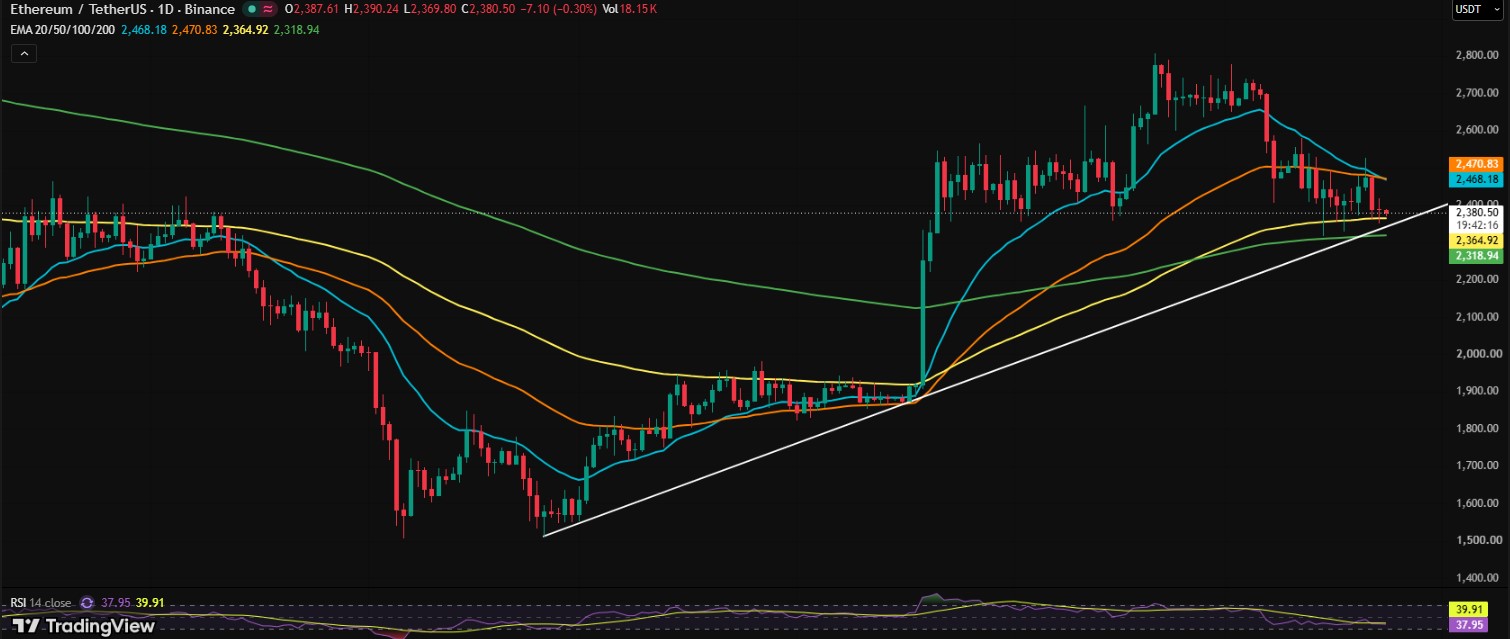
ETH was rejected near $2,700 to $2,750 and has made lower highs since. It trades around 2,380, under the 20-day EMA (2,468) and 50-day EMA ($2,471). RSI is near 38.
Support sits at $2,350 to 2,320. The 100-day EMA (2,365), 200-day EMA ($2,319), and a rising trendline all meet there.
A daily close below $2,320 could open at $2,250 and $2,150. Reclaiming $2,470 may lead to $2,550 to $2,600, with resistance near $2,700.
ETH Level | Value |
20-day EMA | $2,468 |
50-day EMA | $2,471 |
100-day EMA | $2,365 |
200-day EMA | $2,319 |
Support | $2,350 to $2,320 |
Downside targets | $2,250, $2,150 |
Upside targets | $2,550 to $2,600, then $2,700 |
Why Is XRP Down Today?
XRP is at $1.2913 in a descending channel. It is under all four major EMAs: $1.3533 (20-day), $1.3673 (50-day), $1.3350 (100-day), and $1.3729 (200-day). RSI is near 38, close to oversold.
Support is $1.28 to $1.25. A break may lead to $1.22 to $1.20. A move above $1.335 could target $1.35 to $1.37, then $1.45 to $1.50.
XRP Level | Value |
20-day EMA | $1.3533 |
50-day EMA | $1.3673 |
100-day EMA | $1.3350 |
200-day EMA | $1.3729 |
Support | $1.28 to $1.25 |
Downside targets | $1.22 to $1.20 |
Upside targets | $1.35 to $1.37, then $1.45 to $1.50 |
Will the Fed Cut Interest Rates in October 2026?
Unlikely. Data from October 23 shows a 90% chance the Fed holds at 3.75% to 4.00%. A 25 basis point hike to 4.00% to 4.25% has a 10% chance. A cut is at 0%.
Time | Hold | Hike |
Now | 90.0% | 10.0% |
1 day ago | 94.5% | 5.5% |
1 week ago | 84.5% | 15.5% |
1 month ago | 29.1% | 70.9% |
Hike bets have faded over the month, though the 10% is not zero.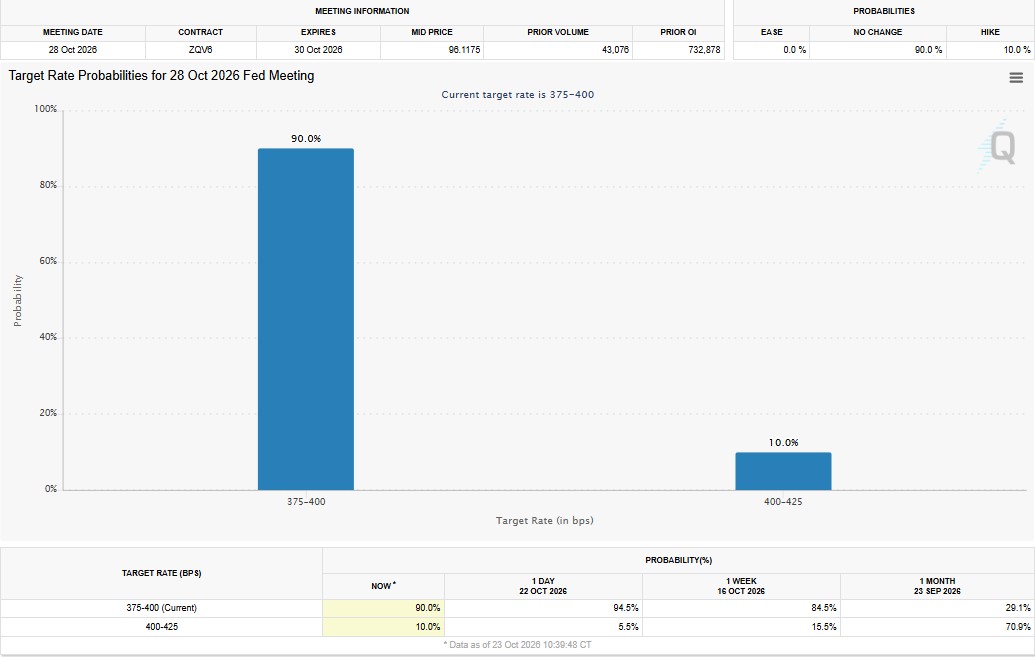
How Much Crypto Was Liquidated Today?
As per CoinGlass data, about 178,645 traders lost $467.67 million. Longs took $318.78 million (68.2%) and shorts $148.90 million (31.8%). Binance had 49% of the total.
Period | Total | Long | Short |
1 hour | $2.97M | $1.02M | $1.95M |
4 hours | $15.93M | $8.47M | $7.46M |
12 hours | $351.85M | $250.44M | $101.41M |
24 hours | $467.67M | $318.78M | $148.90M |
Bitcoin led with $91.09 million, and 89.3% of it was longs. IRYS followed at $68.10 million, mostly shorts (86.7%). ETH saw $60.79 million, with 82.6% longs.
The largest single order was $4.77 million, a long on Binance ETHUSDT at $2,368.44.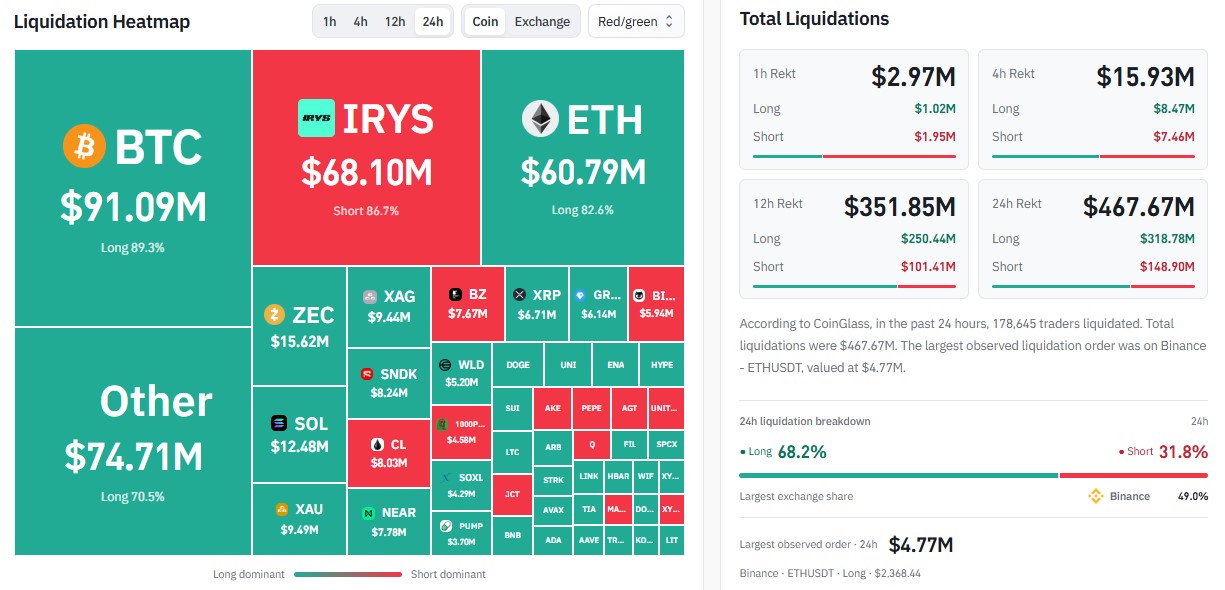
What Happens Next? Key Levels to Watch for BTC, ETH and XRP
The channels decide a lot here. A clean break up or down will likely set the next big move.
For now, the outlook is bearish to sideways. Here is how each coin could go from here.
Coin | If Support Breaks | If Buyers Defend |
Bitcoin | $80,000 to $79,000 fails, then $77,500 and $76,000 | Above $82,300, then $84,000 to $85,000 |
Ethereum | Daily close under $2,320, then $2,250 and $2,150 | Above $2,470, then $2,550 to $2,600 |
XRP | $1.28 to $1.25 fails, then $1.22 to $1.20 | Above $1.335, then $1.35 to $1.37 |
These are levels from the charts, not promises. The Fed meeting and the midterms could add sharp swings. Nobody can say which way it goes.
Disclaimer
This article is for information only and is not financial advice. Crypto assets are volatile, and you can lose money. Do your own research and speak with a licensed advisor before investing.
0
0


 Manage all your crypto, NFT and DeFi from one place
Securely connect the portfolio you’re using to start.
 Where will Bitcoin trade next?
Live Polymarket and Kalshi odds on Bitcoin price targets, compared side by side.
See Bitcoin price odds


