
Chainlink Price Outlook: Can Moody's Pilot Lift LINK Past $10.97?

0
0

What happens to a sluggish altcoin when Wall Street's rating desk starts testing its rails?
That question drives this Chainlink price outlook. Institutional headlines keep arriving, and buyers have heard the pitch before, which is why the adoption already priced in debate never faded. This Chainlink price prediction checks what the LINK price today says about it.
Chainlink Price Outlook After the Moody's Pilot
What Moody's Ratings and Chainlink Tested
Chainlink's X announcement covers a simultaneous multi-chain pilot for Moody's Ratings data, built on Chainlink CCIP and DataLink. CCIP is the cross-chain messaging protocol.
Ratings reached permissioned and permissionless networks in one pass. But it ran on a testnet, and testnet work rarely moves spot demand overnight.
Why the Headline Hasn't Lifted Price
LINK traded at $11.09 at 05:54 UTC on November 3, 2026. It sits at $10.38 now, a 6.4% slide.
Institutional names keep stacking up, from the Hanwha partnership to S&P Global Ratings. But buyers aren't paying up for it.
LINK Price Today Snapshot
CoinMarketCap Market Data
CoinMarketCap data ranks LINK 14th at $10.38, down 0.61% in 24 hours.
Market cap is $7.76B, with 24-hour volume at $235.58M, up 2.8%. That's 3.03% of market cap changing hands, a modest turnover. Price sits 80.38% under the $52.88 all-time high.
CoinGlass Futures Data
Longs got hit again. CoinGlass futures data shows $1.42M liquidated in 24 hours. Longs made up 97% of it.
Futures volume ran $414.71M. Spot managed $74.54M. Open interest, the value of live futures contracts, slipped 0.96% to $470.91M.
Funding stays positive at 0.0089%, so longs keep paying shorts. Fear and Greed sits at 30.
Chainlink Price Analysis Through the Wedge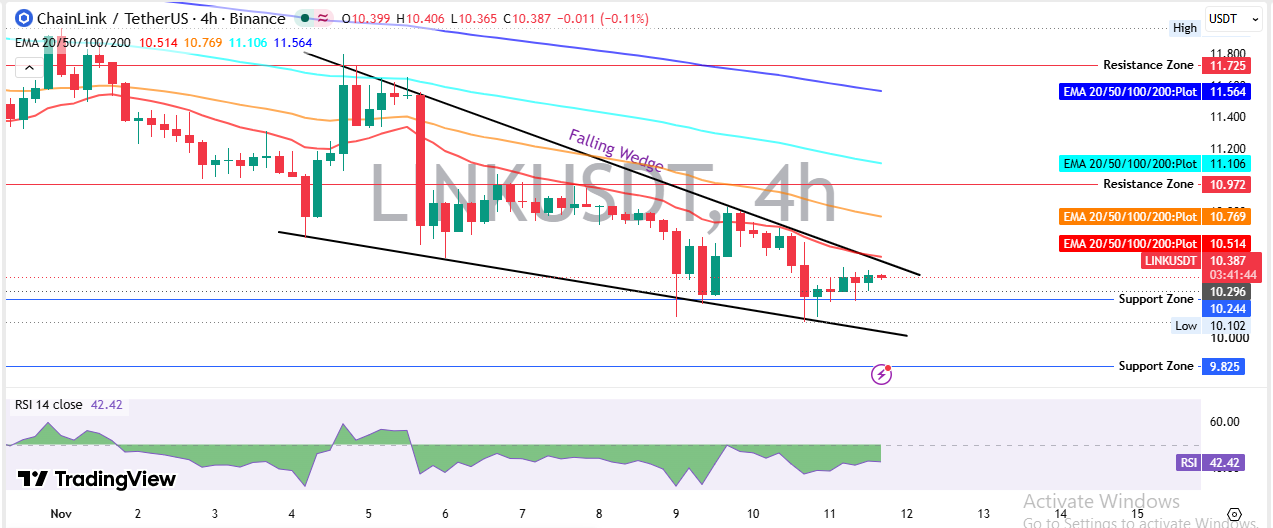
From the Spike to the Dip
On TradingView's 4H chart, LINK starts above $11.20 before sellers drag it toward $10.64. Buyers answer with a sharp bounce. Straight into the $11.725 resistance zone, topping out near $11.80.
Then one heavy red candle wipes out most of that rally. Price grinds near $10.80 to $11.05 for several sessions before sellers print a $10.102 low.
A rebound hits the 50 EMA near $10.769 and fails. Another dive follows. And now the price trades at $10.387, pressing the upper wall of a falling wedge, a narrowing pattern where both trendlines slope down.
Chainlink Support and Resistance Levels
Chainlink support and resistance start at $10.296 and $10.244, just 1.38% under spot. Below sit $10.102 and $9.825 at -5.41%.
Buyers meet $10.514 first, then $10.972 at +5.63% and $11.725 at +12.88%. A falling wedge setup usually resolves with a sharp break.
Bearish felt like the easy call. Then price pressed the wedge's upper wall, and the RSI held above 40, so the stance softens a notch.
EMA Stack and RSI
All 4 EMAs sit above price and slope down. Those are exponential moving averages, which weight recent prices more. The 20 EMA is $10.514, the 50 EMA is $10.769, the 100 EMA is $11.106 and the 200 EMA is $11.564.
So who steps in if $10.244 cracks?
RSI reads 42.42. Sellers lead. But it isn't oversold. A 200 EMA test sits far off at +11.33%.
Chainlink Holders and ETF Demand
Etherscan Holder Data
Etherscan holder data counts 919,536 holders, up from 914,859.
The top 100 wallets hold 60.50% of supply, and 16 wallets own at least 1% each. The Gini index, a 0 to 1 inequality score, reads 0.9896.
SoSoValue ETF Data
SoSoValue ETF data shows $0.00 net inflow for the session that ended at 21:00 UTC on November 10, 2026. Cumulative inflow stands at $176.40M and net assets at $180.18M, or 2.28% of LINK market cap.
Grayscale's GLNK holds $128.46M, and Bitwise's CLNK holds $51.72M. Net assets were $193.64M at 05:54 UTC on November 3, 2026. The two funds fell 2.97% and 3.50% on the day. Demand isn't leaving. But it isn't growing either.
Chainlink Price Prediction Scenarios
The table maps the next 7 to 30 days, a window the November price outlook already framed. Any Chainlink price projection here depends on volume.
Scenario | Trigger | Target | Invalidation | Liquidity Condition |
Bear | Trades below $10.244 on volume | $9.825 | Reclaim of $10.514 | Long liquidations climb, spot stays thin |
Base | Holds $10.244 to $10.514 | $10.244 to $10.514 | Break of either edge | Volume near $235.58M, flat ETF flows |
Bull | Trades above $10.769 | $10.972, then $11.106 | Falls under $10.296 | Spot inflows turn positive |
Chainlink Price Forecast for the Next 7 to 30 Days
The Chainlink price forecast for 7 days favours a range between $10.244 and $10.514 unless the wedge snaps. A hold above $10.514 on rising volume opens $10.769.
Over 30 days, $10.972 decides the bounce, while a loss of $10.244 puts $9.825 in play. The Polymarket channel test shows how LINK handled an earlier floor.
This LINK price prediction treats the Moody's pilot as a catalyst, not a trigger. Spot volume above $235.58M must confirm any breakout.
Risks That Could Change the Chainlink Price Prediction
Longs sit crowded while funding stays positive. So a drop under $10.244 could cascade. An upside wedge break would hurt late sellers just as fast.
And a Moody's move from testnet to live production would turn a headline into demand. RSI at 42.42 has room to fall before the oversold reading from the oversold RSI breakdown returns.
Final Takeaway
Bearish below $10.514. Neutral between $10.244 and $10.514. This Chainlink price outlook turns on a break above $10.972 with volume behind it.
Disclaimer: This Chainlink price outlook is for information only and isn't financial advice. Crypto prices swing fast, and scenarios aren't guarantees. Research independently before any trade.
0
0

 Manage all your crypto, NFT and DeFi from one place
Securely connect the portfolio you’re using to start.


