
Why Is Bitcoin Price Down Today: $398M BTC ETF Outflows & US Midterms

0
0

Bitcoin slipped below $77,000 on November 3 as the market struggled to recover from the late-October sell-off. BTC traded near $76,600, down about 1.90% in 24 hours.
The total crypto market cap fell 1.67% to $2.57 trillion. Ethereum lost around 1.47% to $2,250. Solana, BNB and Dogecoin also moved lower.
BTC Gives Up Monday's Bounce as Asian Stocks Slide
Tuesday's drop erased Monday's brief recovery. BTC could not hold the $77,600 area it tested late Sunday.
Falling Asian equities and caution ahead of the US midterm elections added to the pressure. Doubts about US interest rates are also weighing on sentiment.
Spot ETF Outflows Hit $398.62M, the Largest Since June
US spot ETFs recorded $398.62 million in net outflows on November 2. That was the biggest single-day exit since June.
BlackRock's IBIT led the selling with $405.30 million in outflows. Fidelity's FBTC went the other way and added $6.68 million.
ETF | Sponsor | Daily Net Flow | Net Assets |
IBIT | BlackRock | -$405.30M | $61.96B |
FBTC | Fidelity | +$6.68M | $13.35B |
GBTC | Grayscale | $0 | $9.55B |
BTC | Grayscale | $0 | $4.82B |
BITB | Bitwise | $0 | $2.83B |
Total net assets across all spot ETFs stand at $98.12 billion. That is 6.36% of the market cap. Cumulative net inflows still sit at $56.58 billion.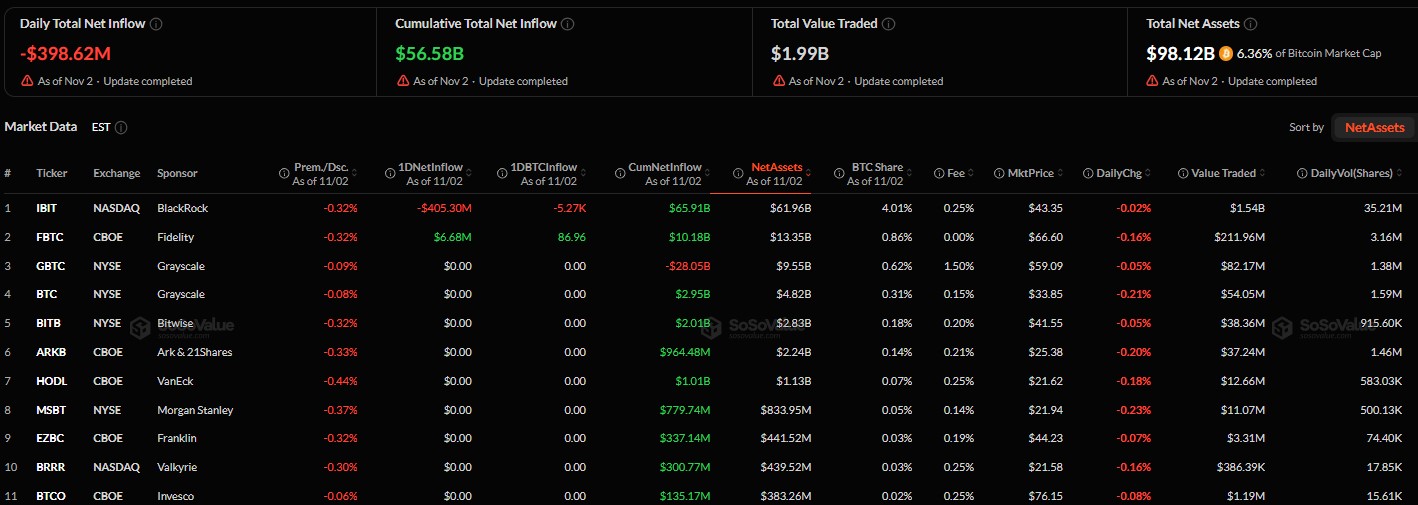
Derivatives Data Shows Longs Took the Hit
Bitcoin futures volume reached $48.71 billion, while spot volume was $4.82 billion. Open interest slipped 1.49% to $52.35 billion.
Options volume jumped 182.25% to $4.11 billion. Traders are clearly active in the derivatives market.
Metric (24h) | Value |
Total liquidations | $98.71M |
Long liquidations | $91.94M |
Short liquidations | $6.77M |
Overall long/short ratio | 0.9539 |
Binance account ratio | 2.6337 |
OKX account ratio | 2.73 |
The overall ratio leans slightly toward shorts. Yet accounts on Binance and OKX still hold more longs than shorts. Bullish traders felt most of the pain.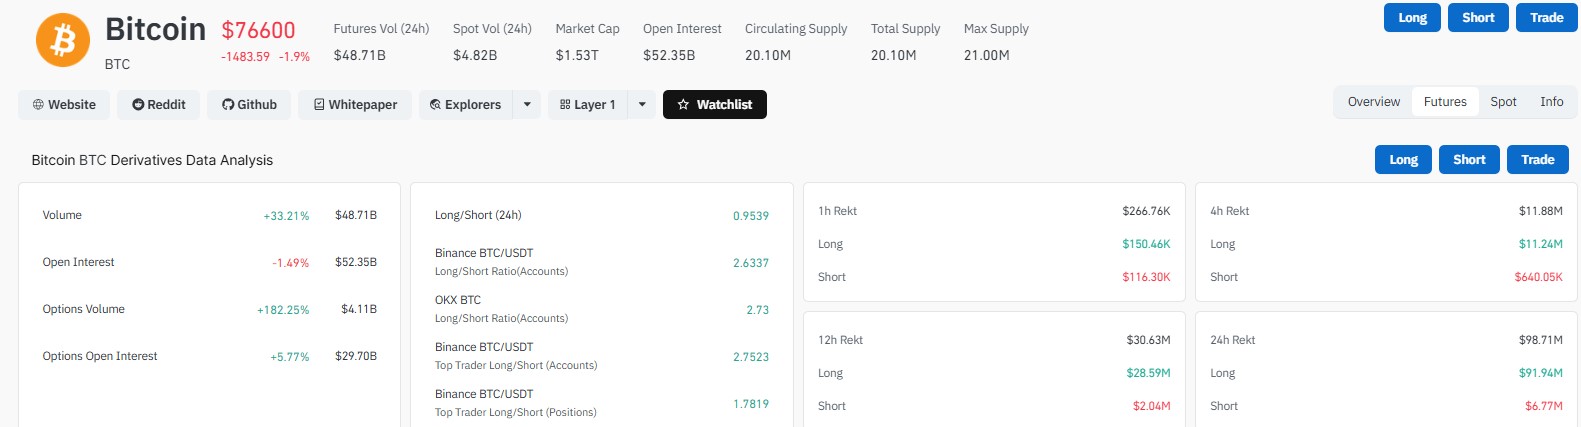
Arthur Hayes Warns Rising Liquidity May Not Be Enough
BitMEX co-founder Arthur Hayes said dollar liquidity is "recharging." He still expects BTC weakness until the Fed or banks start growing their balance sheets.
His chart of the .USDLIQ index showed a reading near 32.71 million. It is up 4.49% for the year, with a high of 32.902 million.
The point is simple. A higher gauge is not the trigger for him. Balance sheet expansion is.Midterm History Gives Mixed Signals
The US midterms are today, and the market may swing hard on the results. A Republican win could support Trump's political position and lift confidence. A loss could add uncertainty for stocks and crypto.
History is not clear. BTC fell 51% after the 2018 midterms and 25% after 2022. Yet Wealthmanager notes BTC gained over the following 12 months in all three past midterm cycles.
BTC has also closed four straight weekly candles in red. Since 2011, it has never printed five in a row during a bull run. This week's close matters.
Key Levels Traders Are Watching
Analyst Michaël van de Poppe sees $75,000 as an "obvious long" zone. He pointed to a clear rejection at $79,000 that pushed price back toward the lows. He also thinks the midterms could mark a low in a "sell the rumor, buy the news" move.
If selling speeds up after the Binance hack and the election, $73,000 is the next level to watch. That is near the short-term holder cost basis.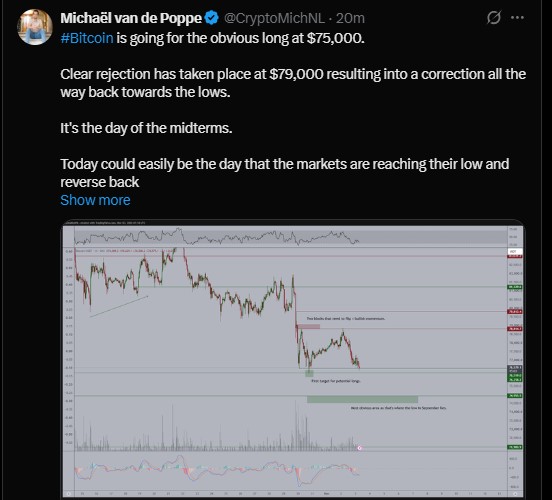
Level | Why It Matters |
$79,000 | Clear rejection, key resistance |
$77,600 | Area tested late Sunday |
$76,600 | Current trading zone |
$75,000 | Dip-buy zone flagged by van de Poppe |
$73,000 | Short-term holder cost basis |
What Comes Next for BTC
The next move likely depends on the election result, ETF flows, and the Fed. A bounce above $77,600 would ease some pressure. A break below $75,000 would put $73,000 in focus.
Nothing is certain here. The setup can flip fast, so traders should watch the weekly close.
Disclaimer
This article is for information only and is not financial advice. Cryptocurrency prices are highly volatile, and you can lose some or all of your money. Do your own research and speak with a licensed financial advisor before making any investment decision.
0
0


 Manage all your crypto, NFT and DeFi from one place
Securely connect the portfolio you’re using to start.
 Where will Bitcoin trade next?
Live Polymarket and Kalshi odds on Bitcoin price targets, compared side by side.
See Bitcoin price odds


