
Zcash Price Prediction: ZEC Need 2–3 Months to Cool Off? What’s Next!

0
0

Does ZEC need 2–3 months to cool off? One trader says yes, based on its last two cycles and a bearish RSI signal on the monthly chart. The daily chart fits that view for now.
ZEC bounced 7.4% yesterday, was rejected at its broken trendline and trades at $1,179.84, under $1,201.01 and both EMAs. This Zcash Price Prediction checks the claim against the levels.
Market data checked on November 4, 2026, at 09:30 IST.
Why is Zcash price up today?
The Zcash price today is up 5% to $1,179.84 in 24 hours, rebounding against a slightly down market, primarily driven by anticipation of its upcoming network upgrade and a technical bounce from oversold levels.
Primary reason: Anticipation of the NU7 Mainnet upgrade, which promises faster block times and improved efficiency.
Secondary reasons: A technical rebound from recent lows, supported by the re-enabling of ZEC withdrawals on a major exchange post-hack.
Zcash News Today: Trader Says ZEC Needs Time to Cool Off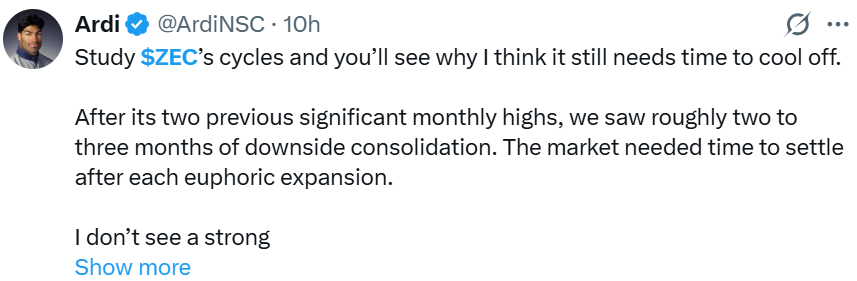
ZEC's cycles show it still needs time to cool off. After its two previous significant monthly highs, he says, ZEC saw roughly two to three months of downside consolidation, as the market settled after each euphoric expansion. He sees no strong reason for this move to skip it.
He adds that in both periods, monthly RSI moved out of overbought territory and back to its middle range. RSI, or relative strength index, is a momentum gauge from 0 to 100, and readings above 70 are often called overbought.
This time, he says, the price made a significantly higher high, but the monthly RSI made a lower high. That is a bearish divergence, a sign that momentum is fading even as price rises.
He still expects sizeable rallies but more consolidation and room for downside before another move higher.
Source: Data From X
The monthly charts were not shown, so CoinGabbar could not check the RSI or the earlier cycles. This is one trader's opinion, and in an earlier post covered on November 2, he said he was short from $1,420.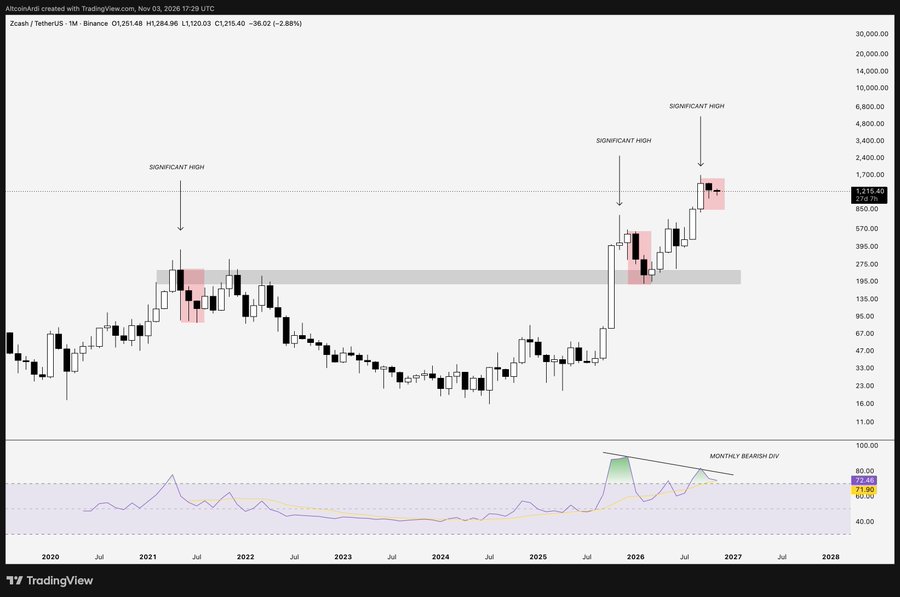
What the Timing Would Mean
ZEC peaked near $1,700.07 in late September. If the pattern repeated, two to three months of consolidation would run from late November to late December. That is CoinGabbar's math, not a rule.
Zcash News: ZEC Liquidation Data
A liquidation happens when an exchange force-closes a leveraged trade because the trader can no longer cover losses. Longs bet on a rise, and shorts bet on a fall.
Window | Total Liquidated | Long | Short |
12h | $4.01M | $2.12M | $1.89M |
24h | $7.47M | $3.42M | $4.04M |
Source: Data From CoinGlass
Over 24 hours, shorts took about 54%, which fits yesterday's bounce. Over the last 12 hours, longs took about 53%, which fits today's drop.
Zcash Prediction: Technical Analysis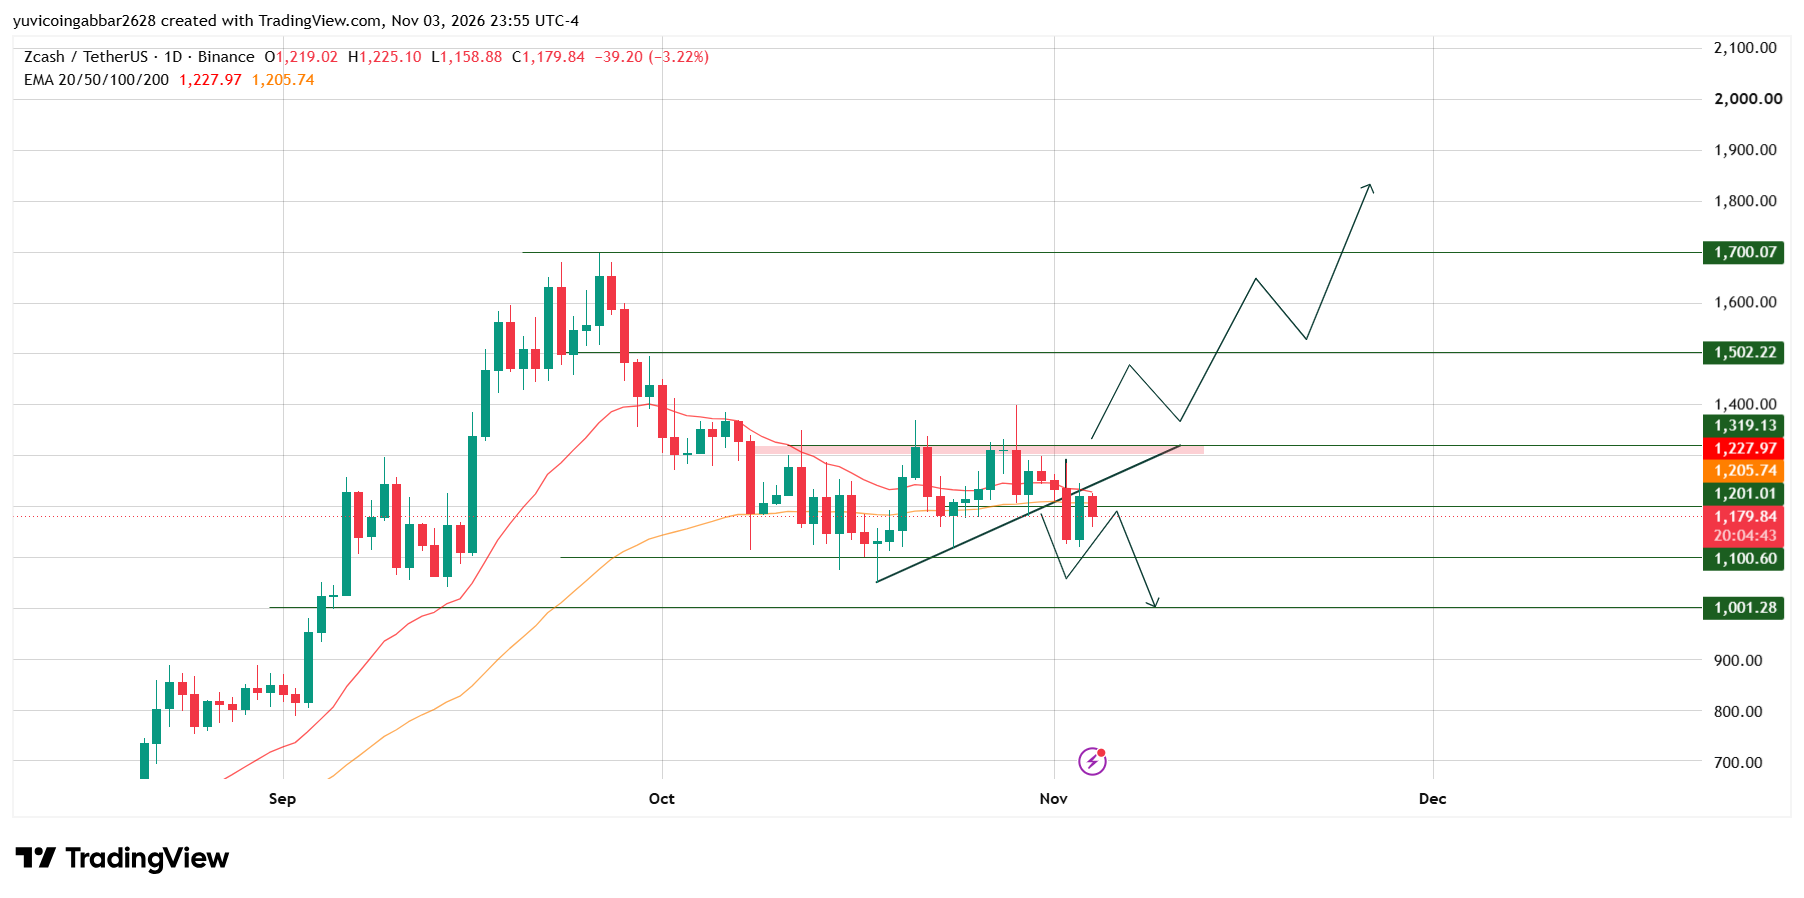
ZEC fell from $1,700.07 in late September to about $1,050 by mid-October. Lows then rose along a trendline until it broke on November 2.
Yesterday's candle opened at $1,134.57 and closed near $1,219.02. Price climbed back to the broken trendline and was rejected. A return to a broken level is called a retest.
Today's candle opened at $1,219.02, fell to $1,158.88 and printed $1,179.84. It was still open, so the close can change.
An EMA, or exponential moving average, weights recent prices more heavily. Price is under both the 20 EMA at $1,227.97 and the 50 EMA at $1,205.74.
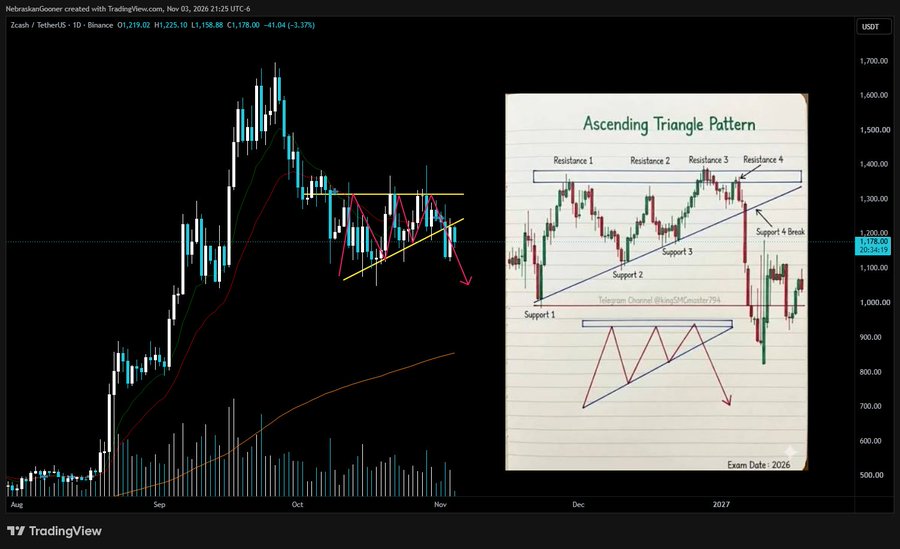
Zcash Ascending Triangle Pattern:
Zcash ($ZEC) Technical Outlook: Ascending Triangle Pattern
Zcash Forecast: Support and Resistance Levels
Type | Level |
Highest marked level | $1,700.07 |
Resistance 3 | $1,502.22 |
Resistance 2 | $1,319.13 |
Resistance 1 | $1,201.01 |
Immediate support | $1,100.60 |
Deeper support | $1,001.28 |
Bull case: A daily close back above $1,201.01, about 2% higher, would put $1,319.13 in view.
Bear case: If $ZEC closes below $1,100.60, about 7% lower, the price could slide about 15% toward $1,001.28.
$ZEC Scenarios and Invalidation (November 4, 2026)
Scenario | Trigger | Likely Outcome | Invalidation |
Bull | Close above $1,201.01 | Move toward $1,319.13 | Close below $1,100.60 |
Base | Range of $1,100.60 to $1,201.01 | Sideways under the old support | Break of either level |
Bear | Close below $1,100.60 | Slide toward $1,001.28 | Close back above $1,100.60 |
Zcash Price Prediction 2026: Can Zcash Reach $1,700.07?
It would take a gain of about 44% from $1,179.84. Any ZEC price prediction toward that level needs more than a bounce.
Zcash Price Prediction: Analyst View
The retest failed and the price is under both EMAs, which fits the cooling-off view. A rejection does not prove a long consolidation.
The level to watch is $1,100.60. A daily close below it would open $1,001.28. A close back above $1,201.01 would be the first real sign of strength.
Disclaimer
This article is for informational purposes only and isn't financial advice. Crypto markets are volatile. Always do your own research before making any trading decisions involving ZEC.
0
0

 Manage all your crypto, NFT and DeFi from one place
Securely connect the portfolio you’re using to start.


